HealthTech, Enterprise UX, Information Architecture
Adaptive Part 3: Patient-Centered Architecture, Specimens and Dashboards
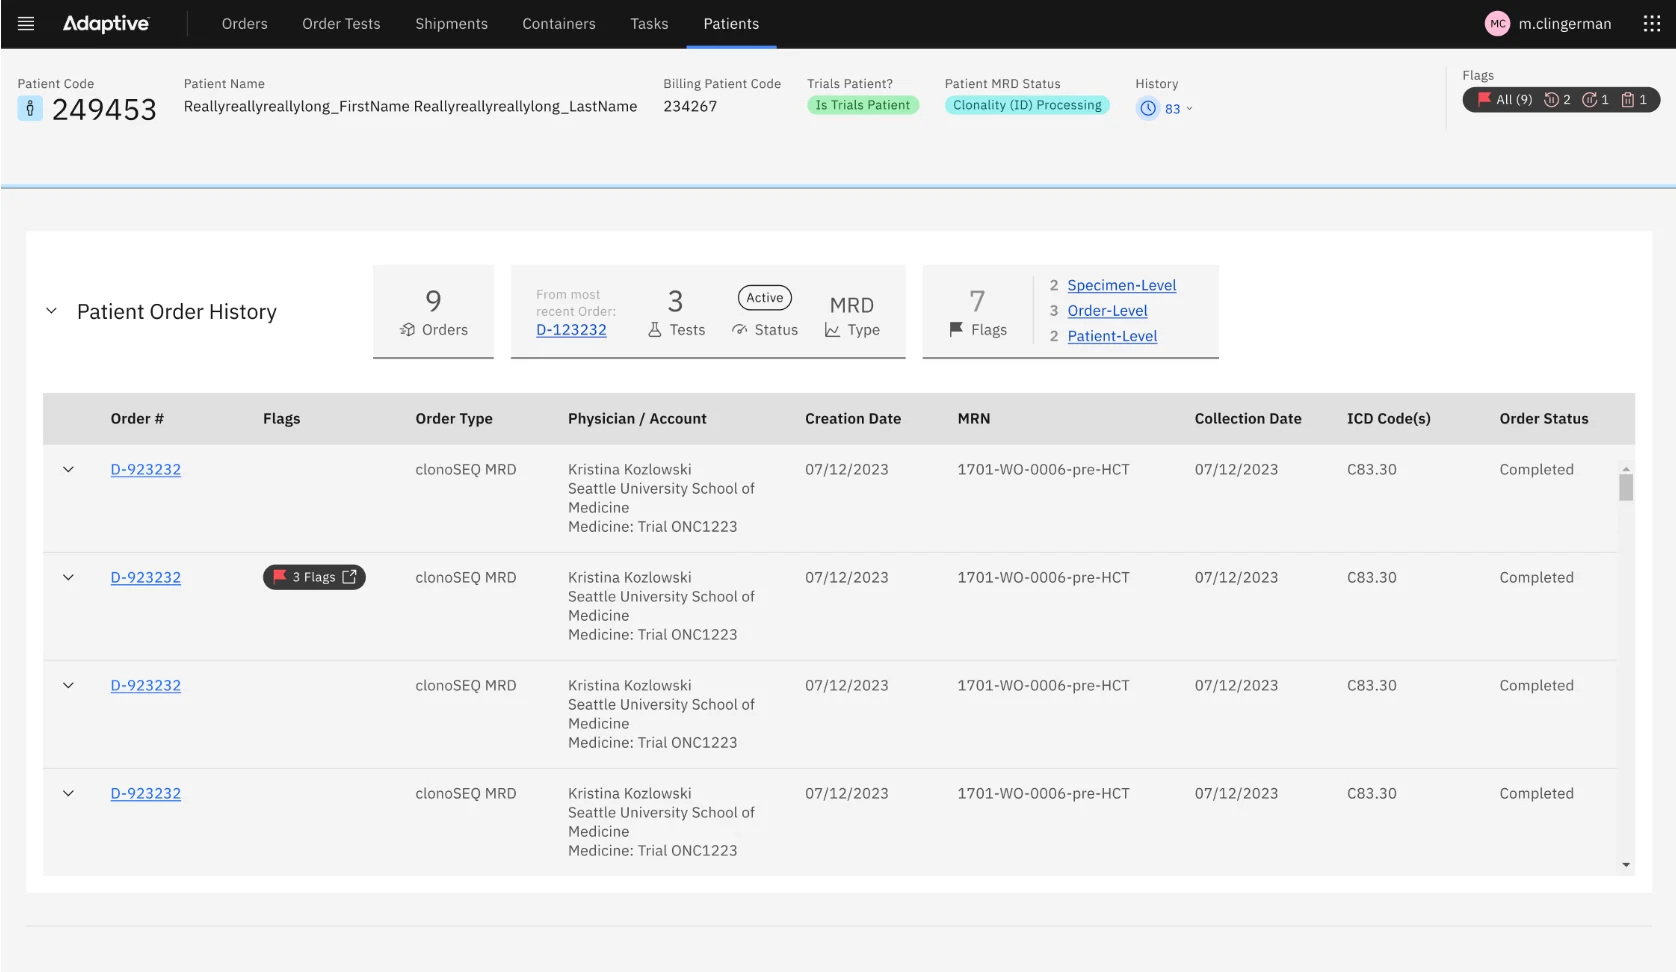
Re-centering Order Management on the patient: a Human record that links clinical care and clinical trial data, specimen tables that show a deep hierarchy without clutter, and dashboards that start every workday with the right questions answered.
Adaptive Biotechnologies
- 01 Problem
Information was organized around orders, not patients. Clinical trial data couldn't be linked to a patient already in the system, specimen and sample data was deep and hard to read, and teams and leadership had no real view of status or volume.
- 02 Approach
Add a parent Human record over Patient and Subject records, surface live patient status in an aggregate tile, use Carbon's expandable rows, status icons and toolbar for specimens, and build insight tiles for every worklist.
- 03 Outcome
Clinicians get patient-centered answers faster, specimen tables read at a glance with batch tools for large trials, and staff and leadership start the day with live numbers instead of searches.
Putting the patient first

Specimens and samples
Dashboards
Project summary
This is Part 3 of the Adaptive Order Management story. Part 1 covers the research and strategy, and Part 2 shows how the team reduced cognitive load. This part covers three themes from the research: a patient-first architecture, specimen and shipment workflows, and dashboards.
Putting the patient first
Adaptive sees itself as a patient advocacy organization, so the information architecture had to put the patient first.
- Linking Subjects to Patients. Patients who arrive through a clinical care order are Patient records, with identifiable details. Most clinical trial participants are Subject records, de-identified for regulatory reasons. With no link between them, a patient could be asked for the same blood or bone marrow samples more than once. Working with the SMEs, the team drafted a Human record type that sits above both and links its Patient and Subject records.
- Live patient status. A new aggregate tile shows the status of a patient's recent tests and specimens, so analysts can answer a clinician's question without opening a stack of orders in separate tabs.
- Clear headers. A Header Bar component marks each page as an Order, Subject or Patient.
Specimens and samples
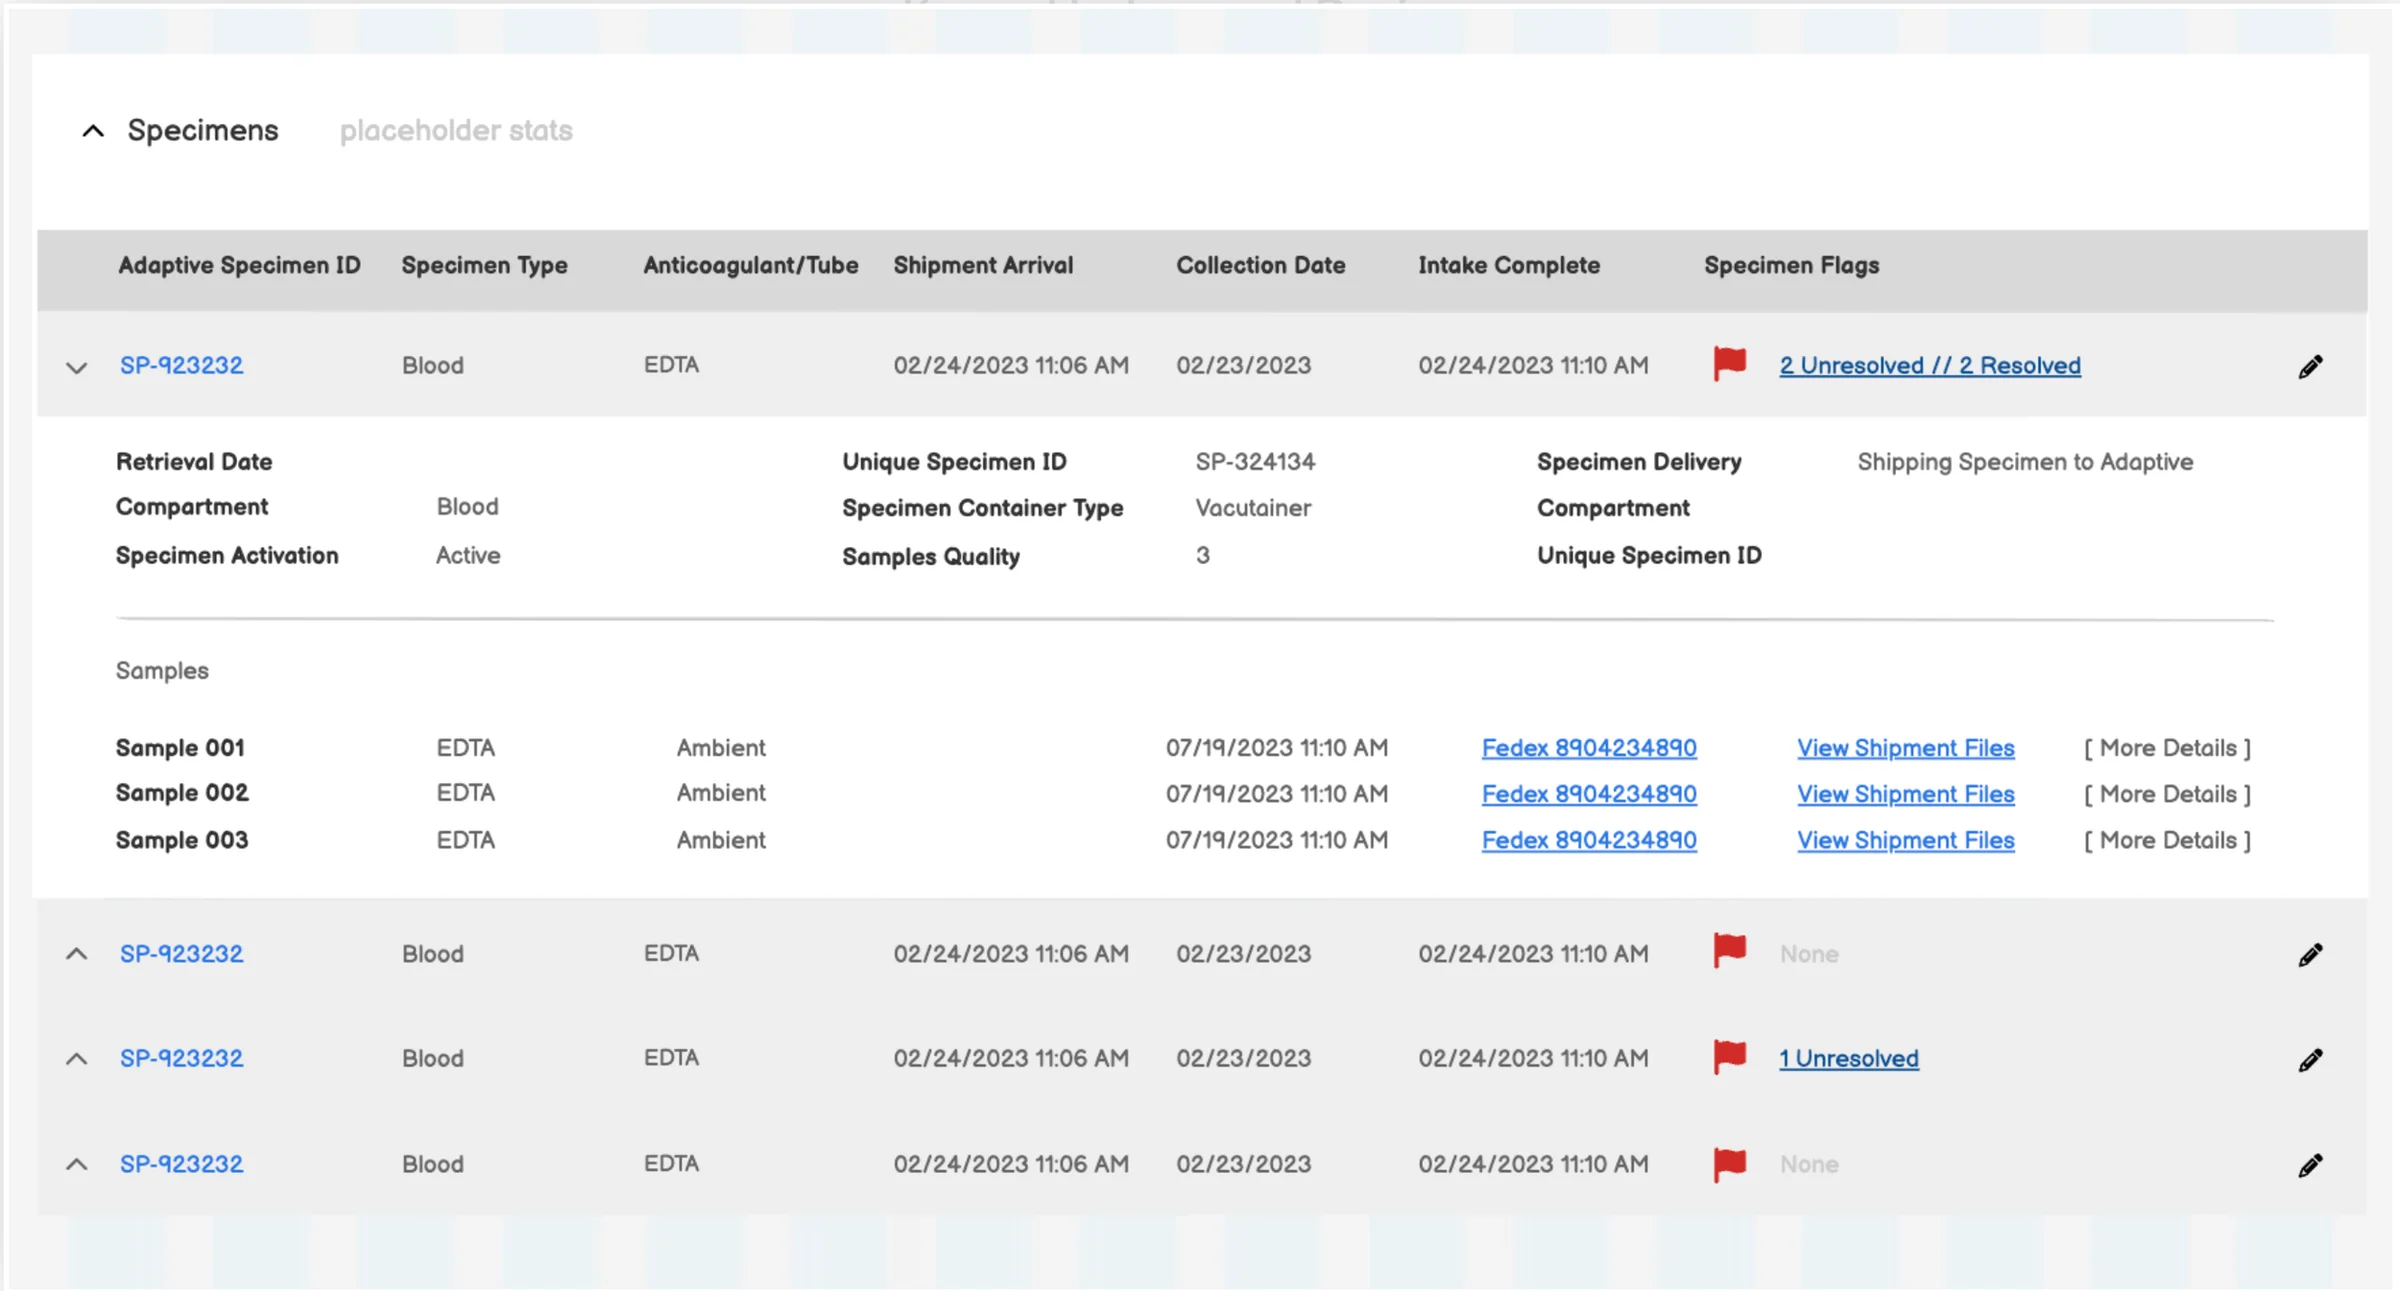
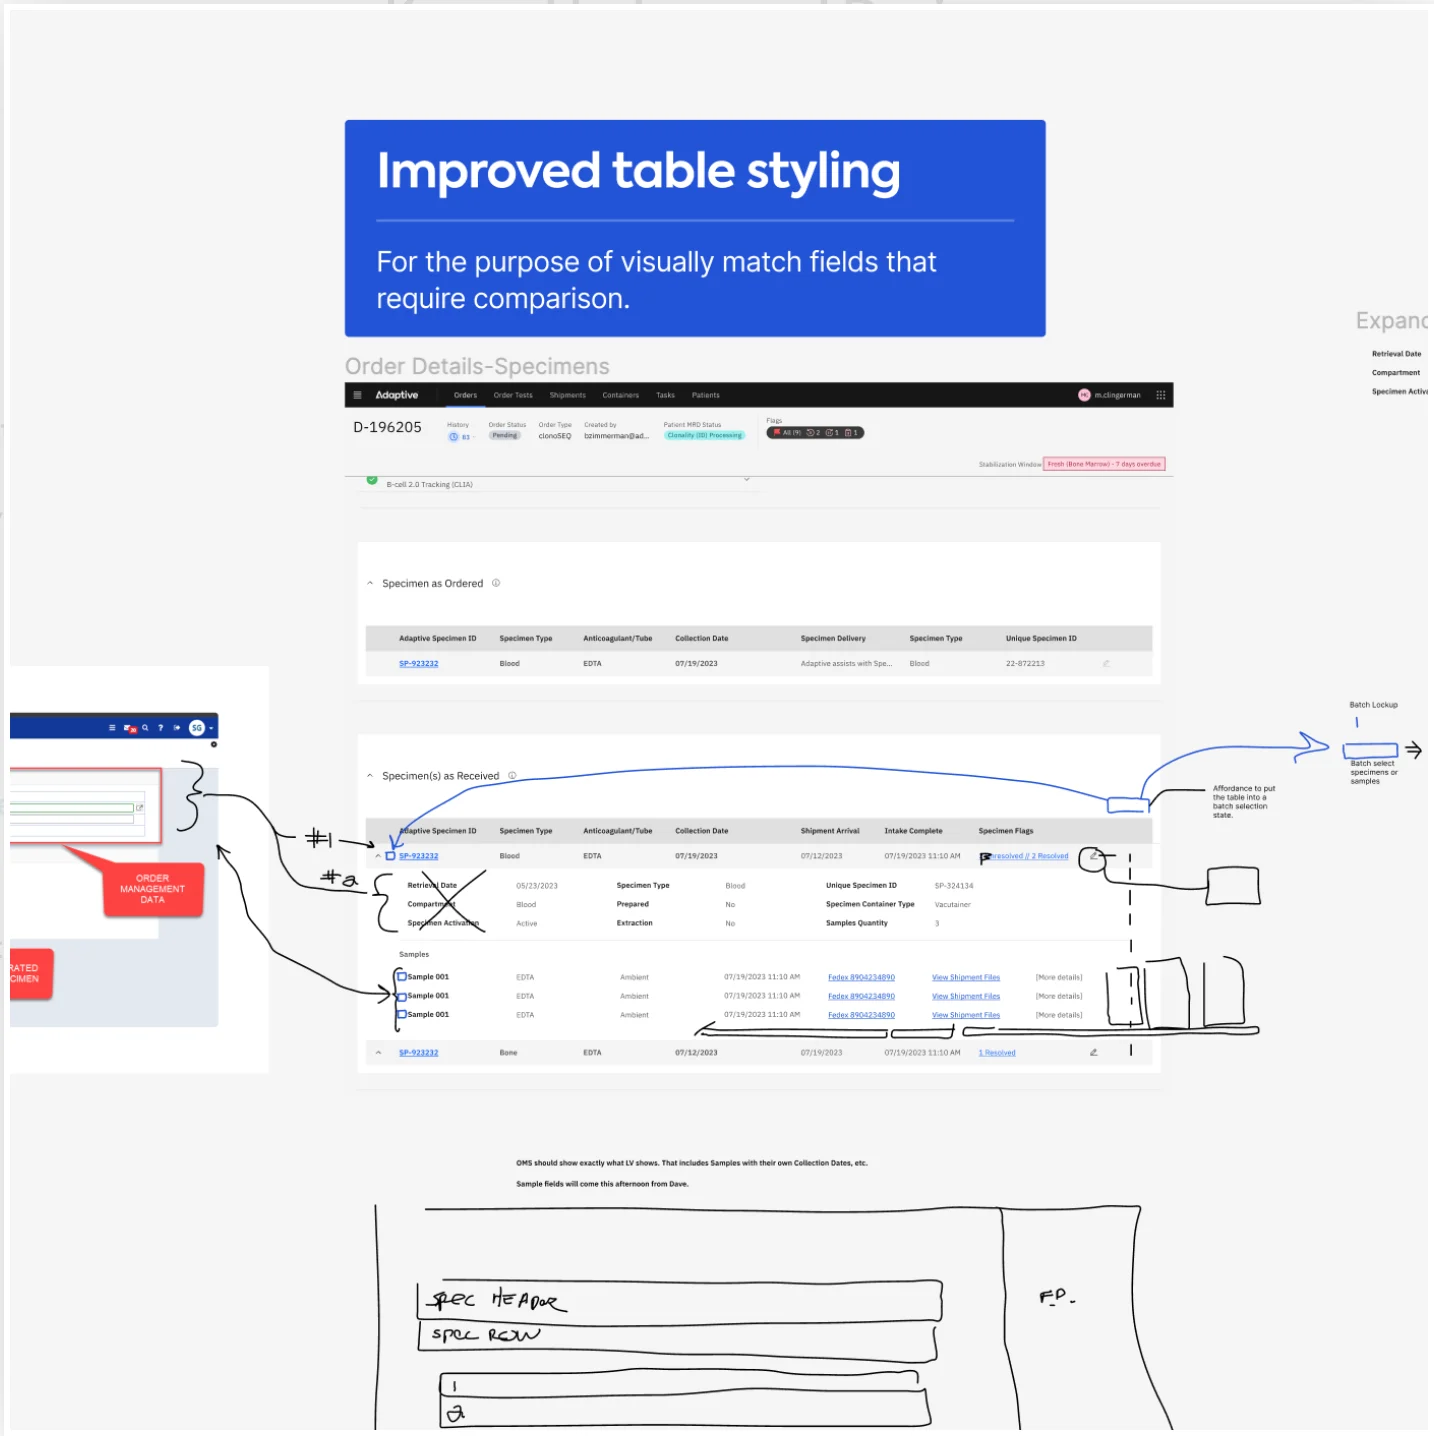
Specimen data needed to move cleanly between the OMS and the LIMS and keep teams updated on shipments. Alongside Flags, from Part 2, the team redesigned the Specimen tables:
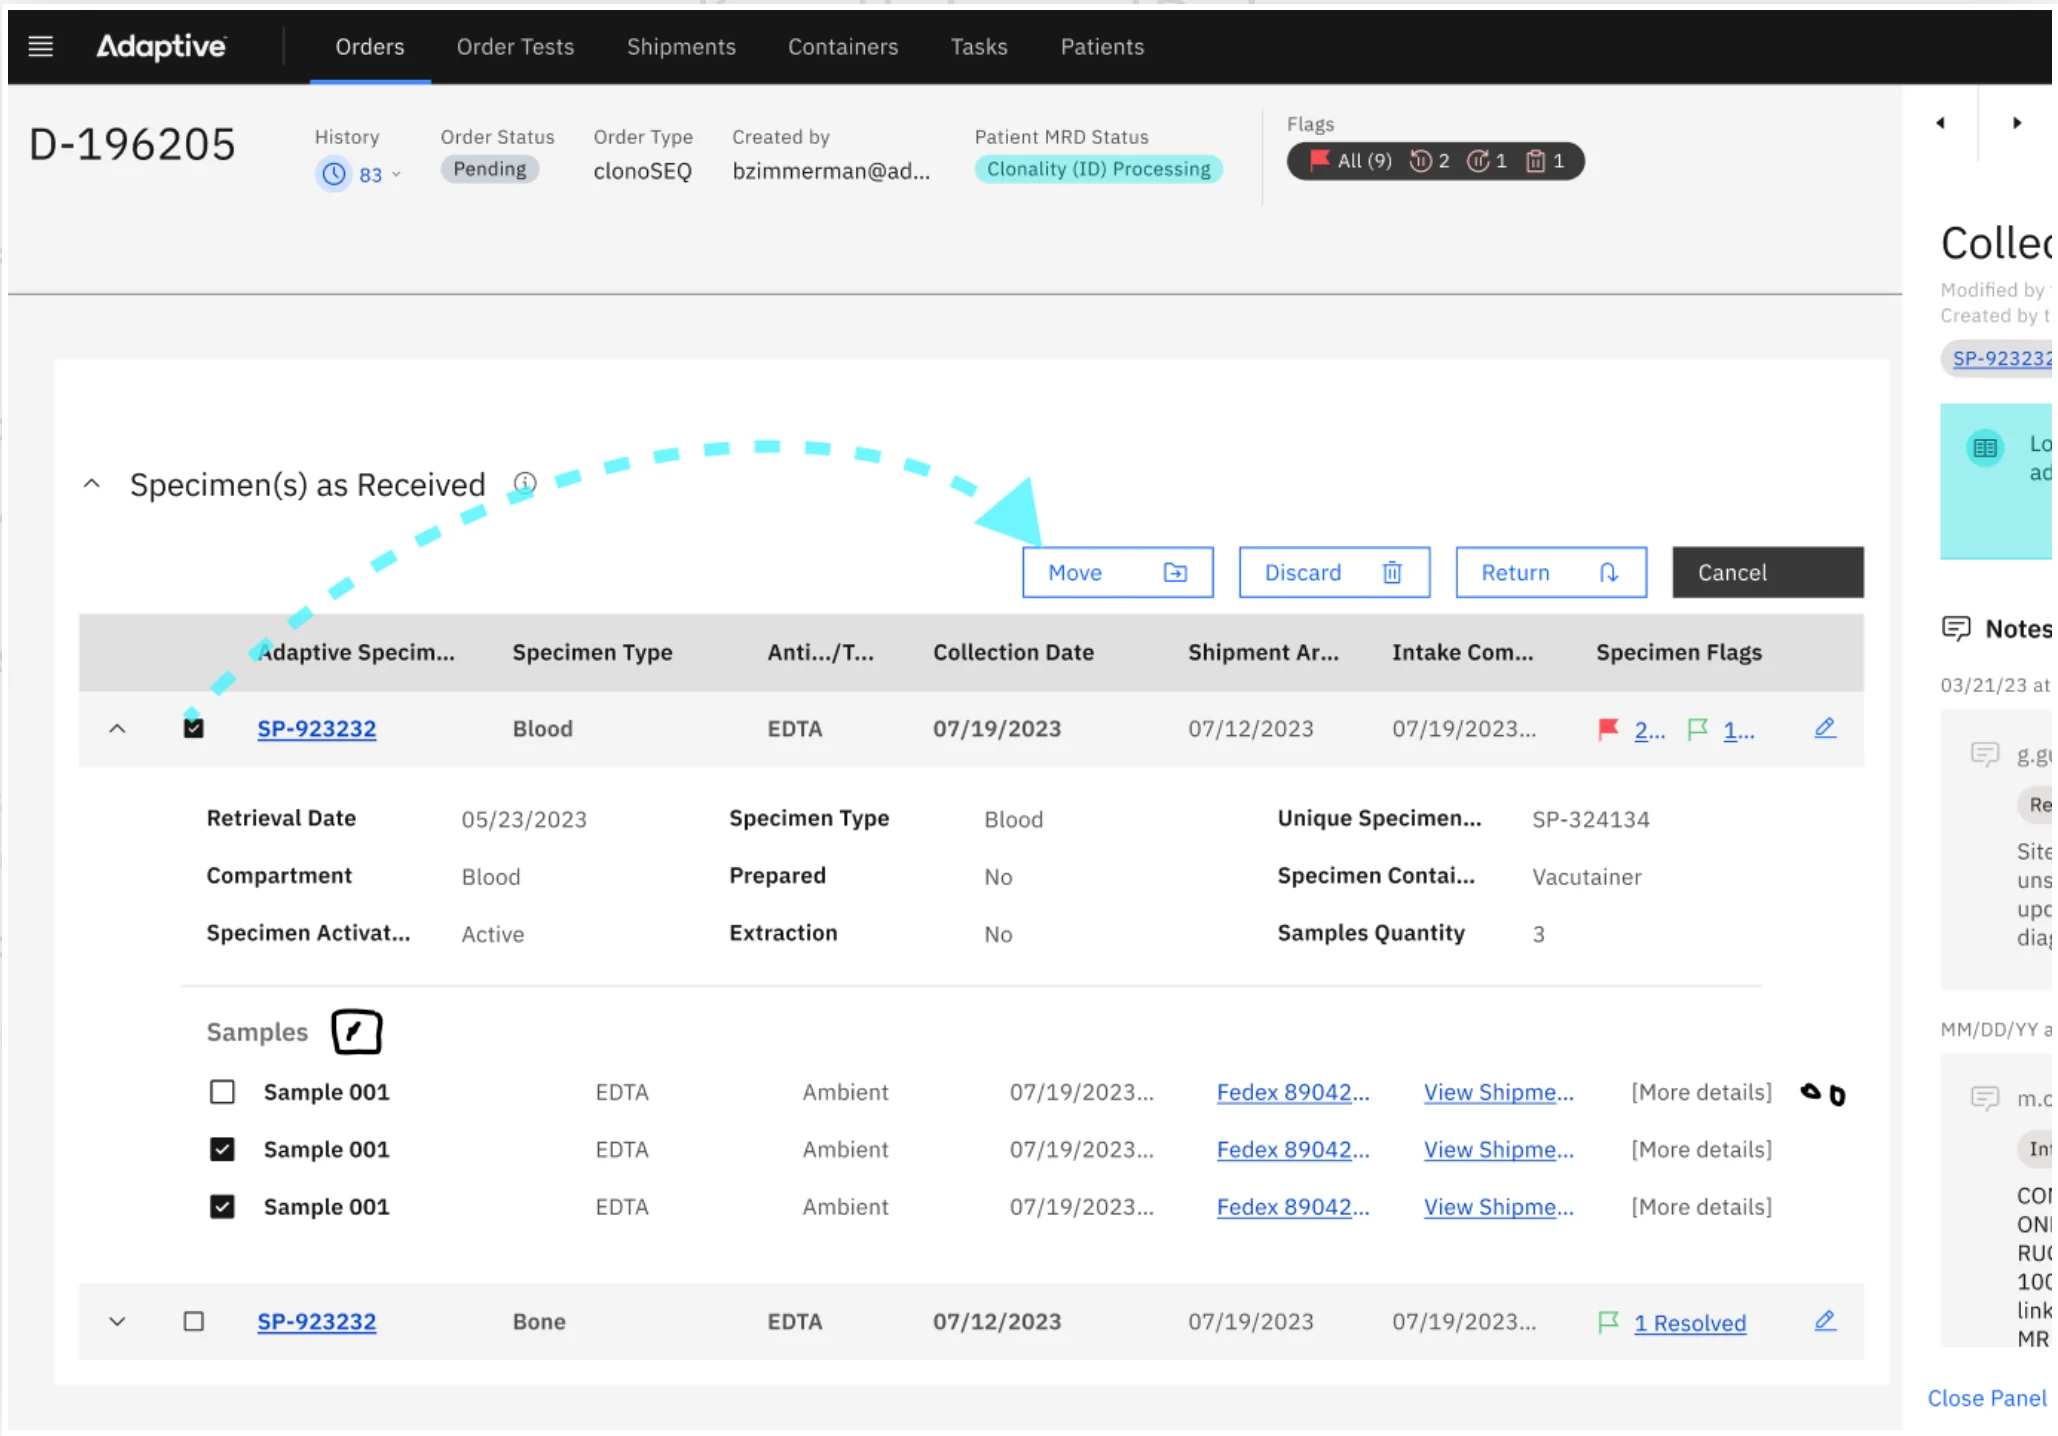
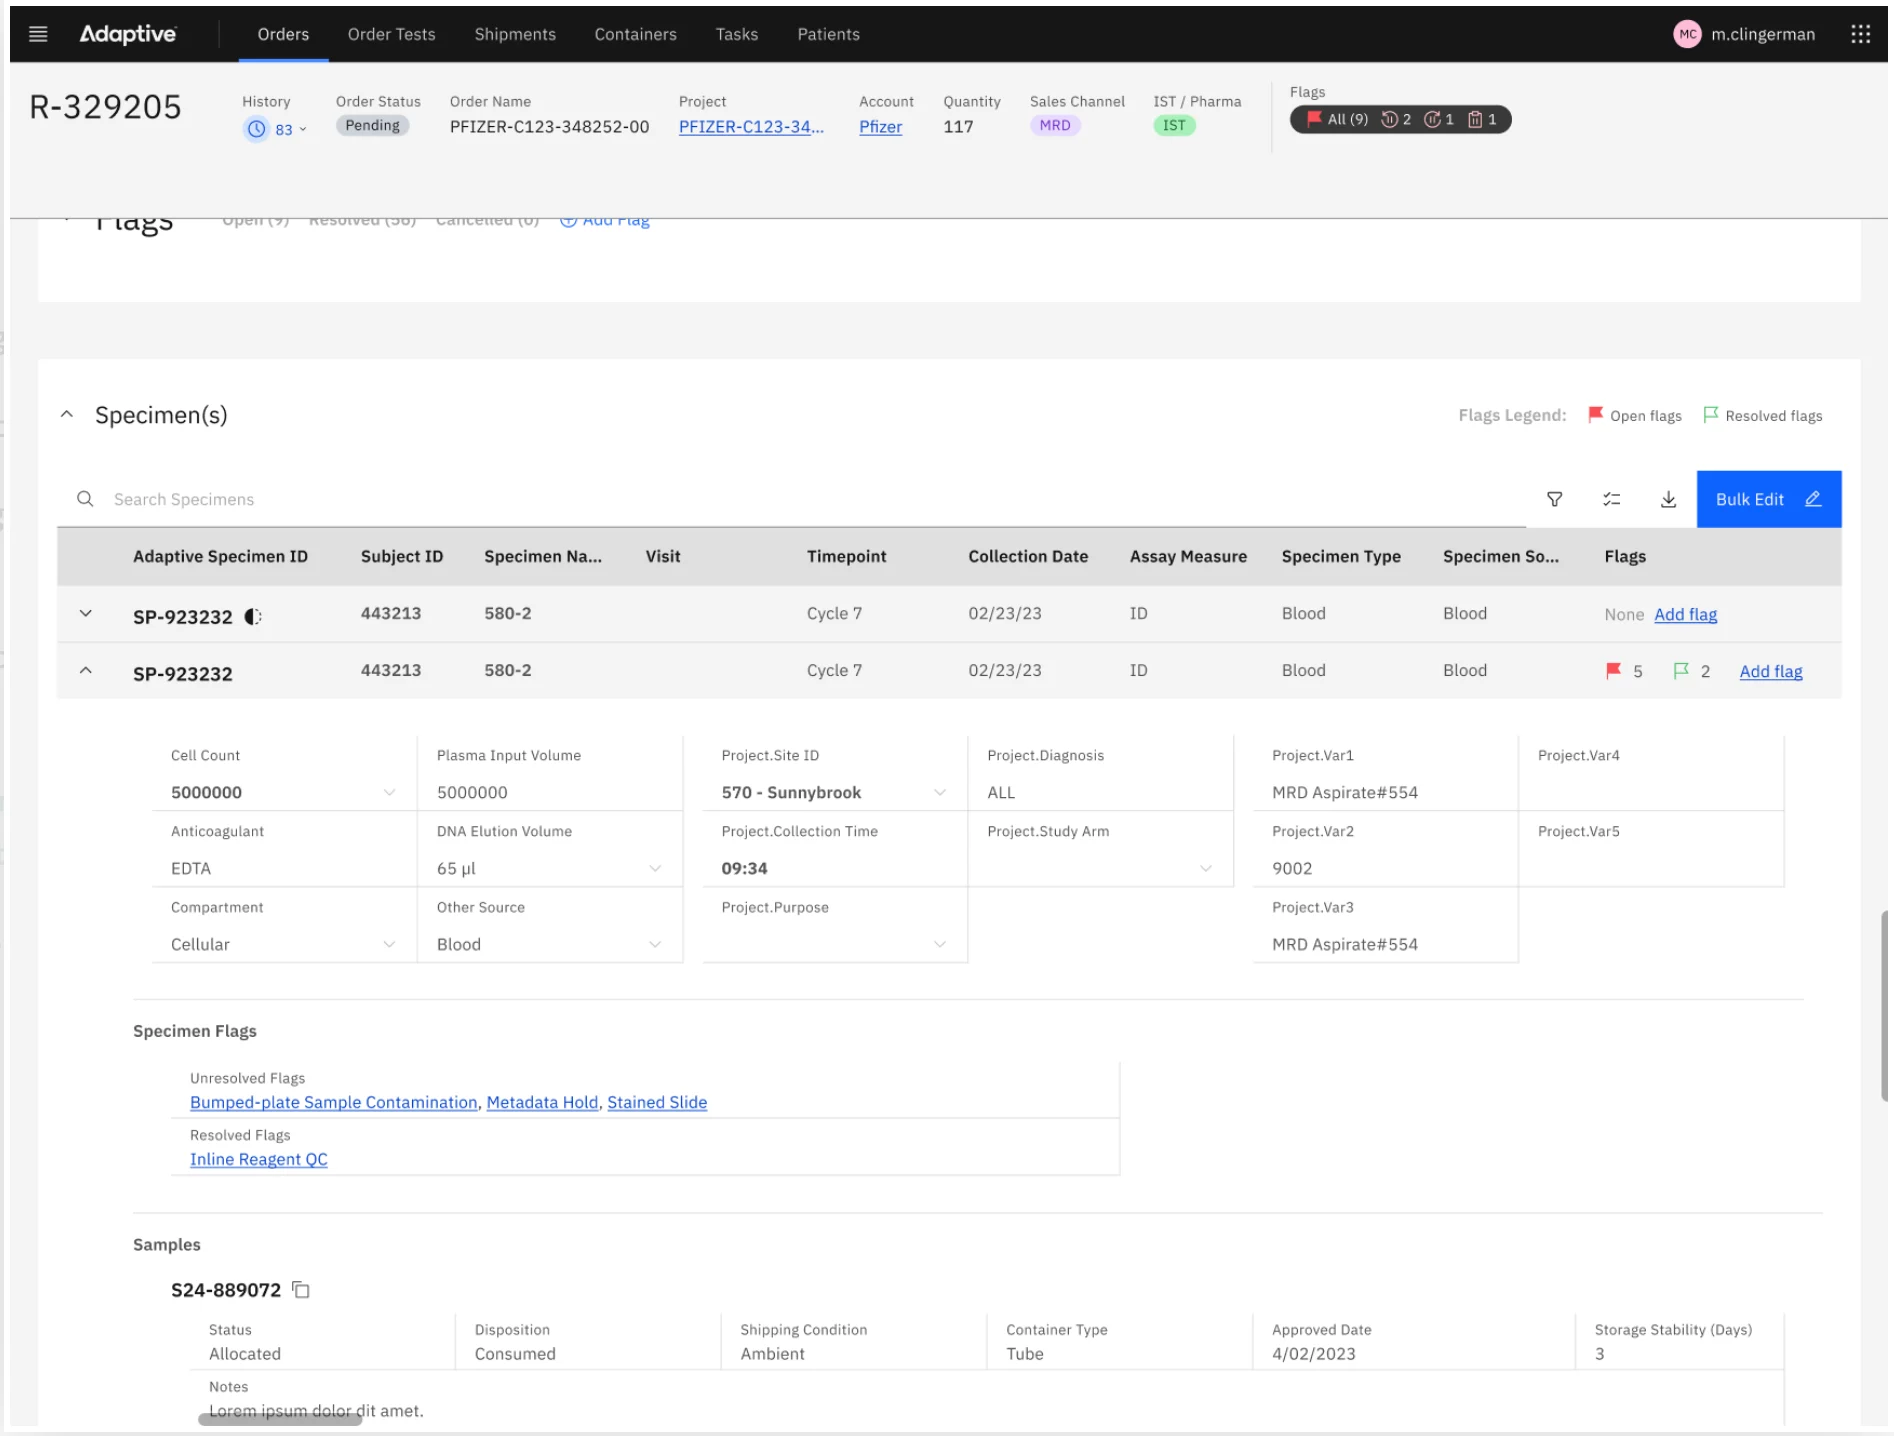
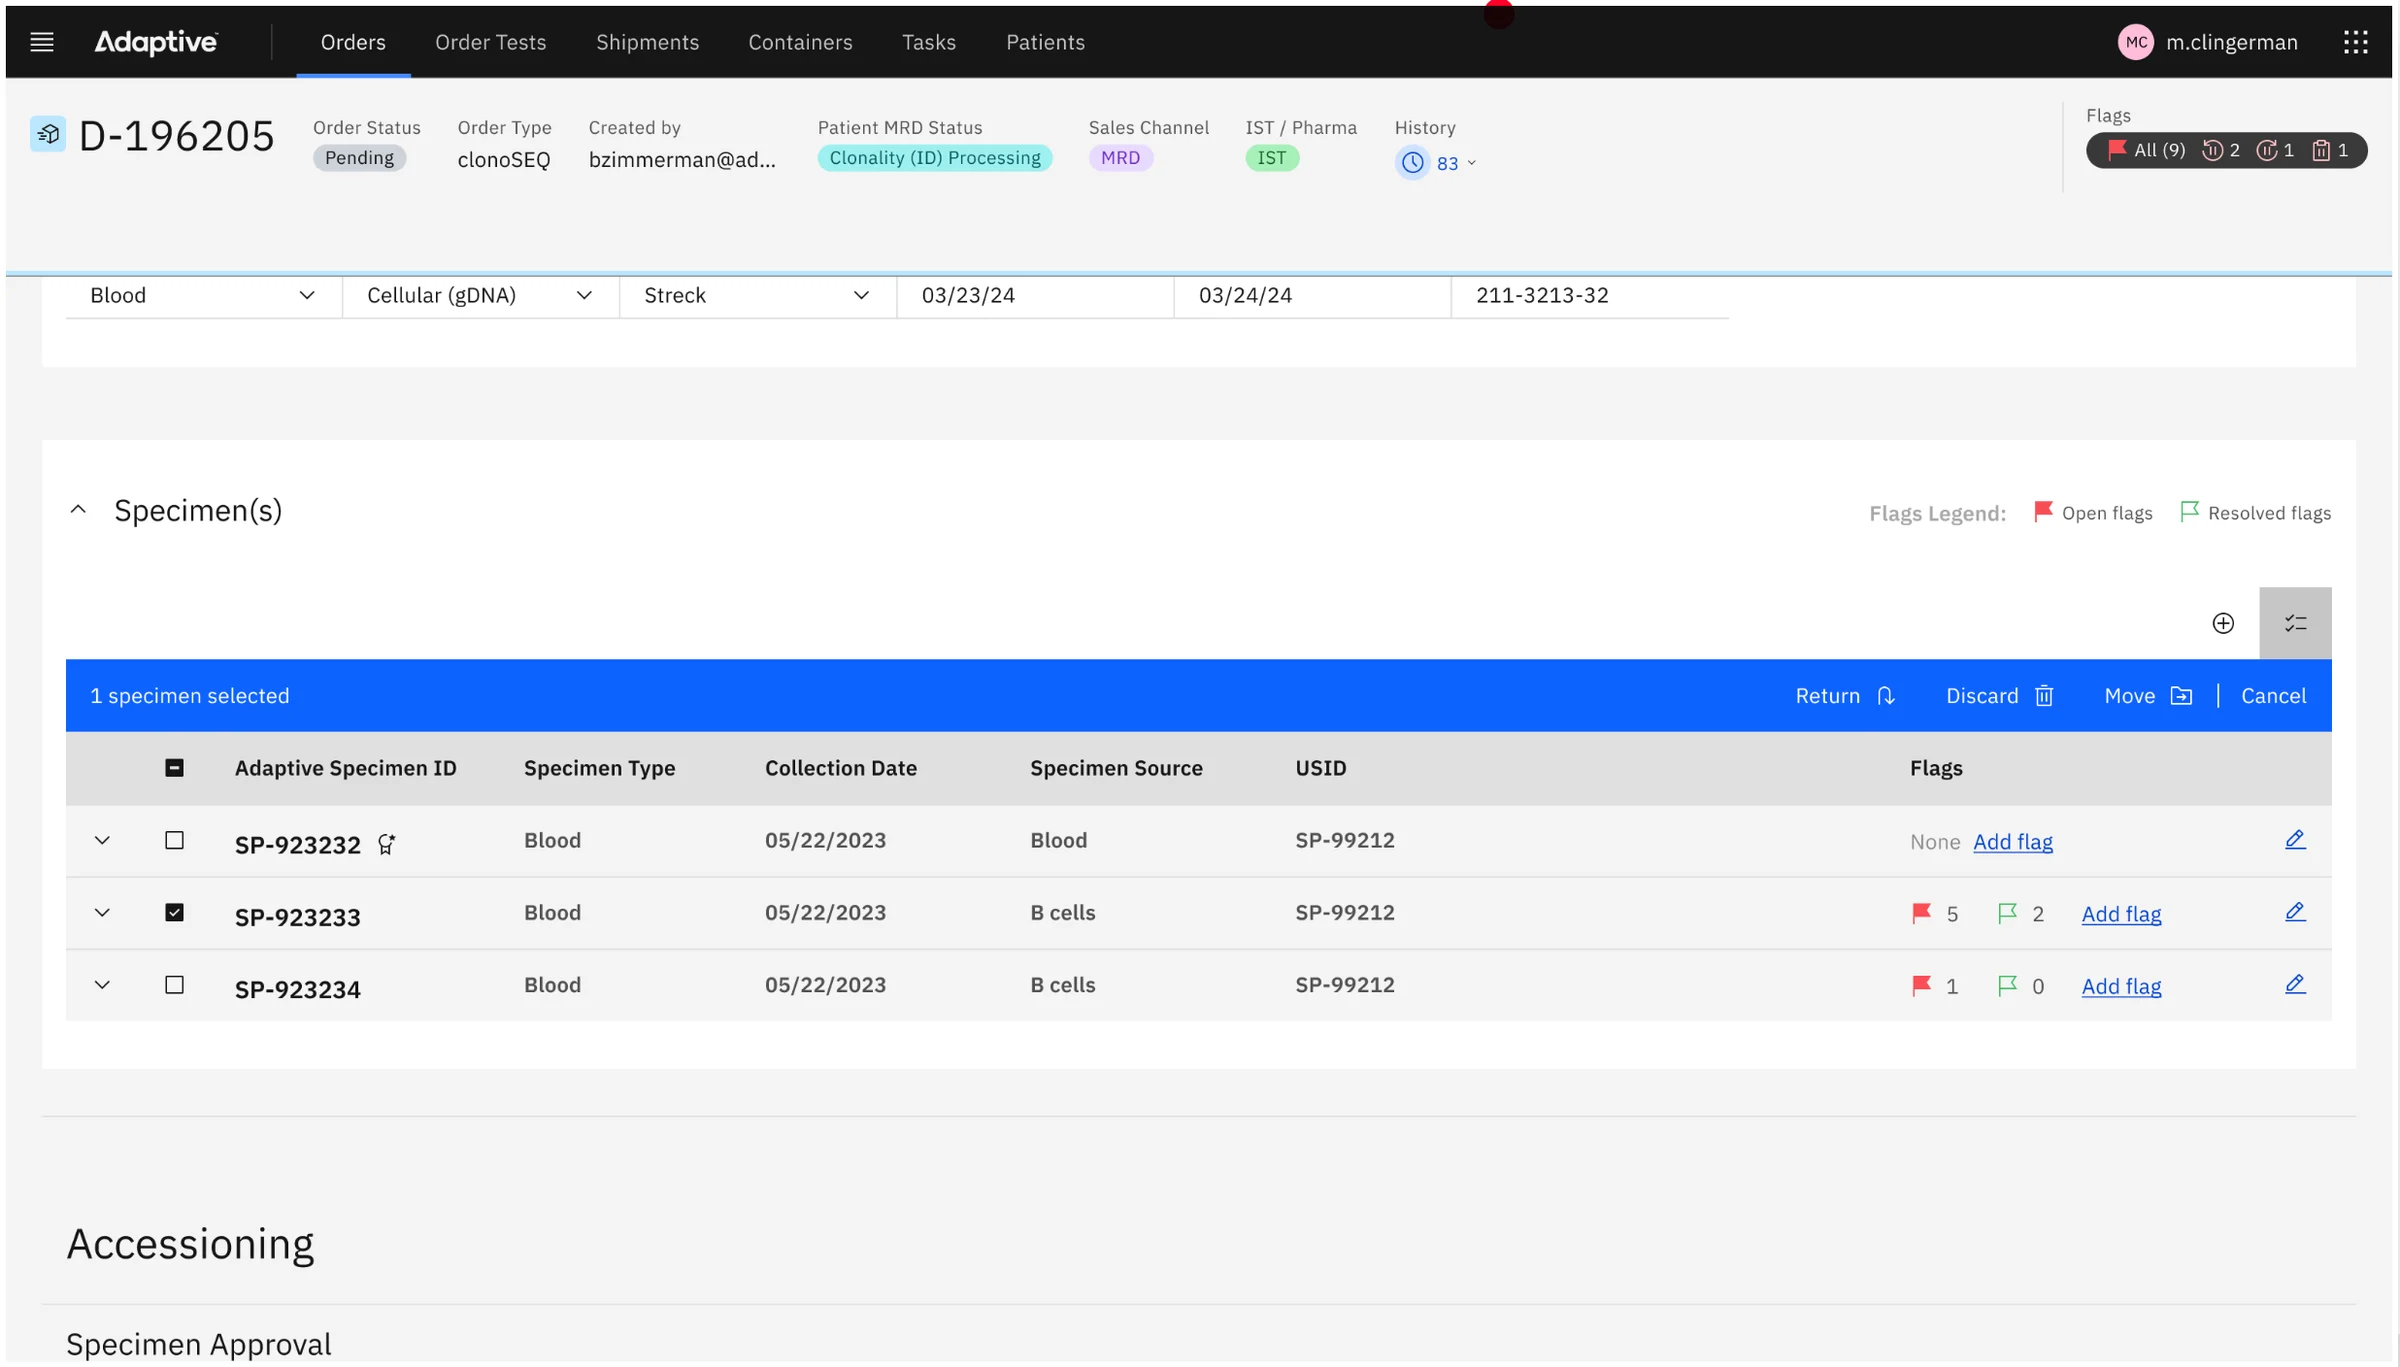
- Expandable rows. Carbon's expandable rows hold the secondary information on a specimen and its child samples. The SMEs helped decide which attributes are primary and which are secondary, and read-only fields use a fluid style so the open row reads as a tidy grid.
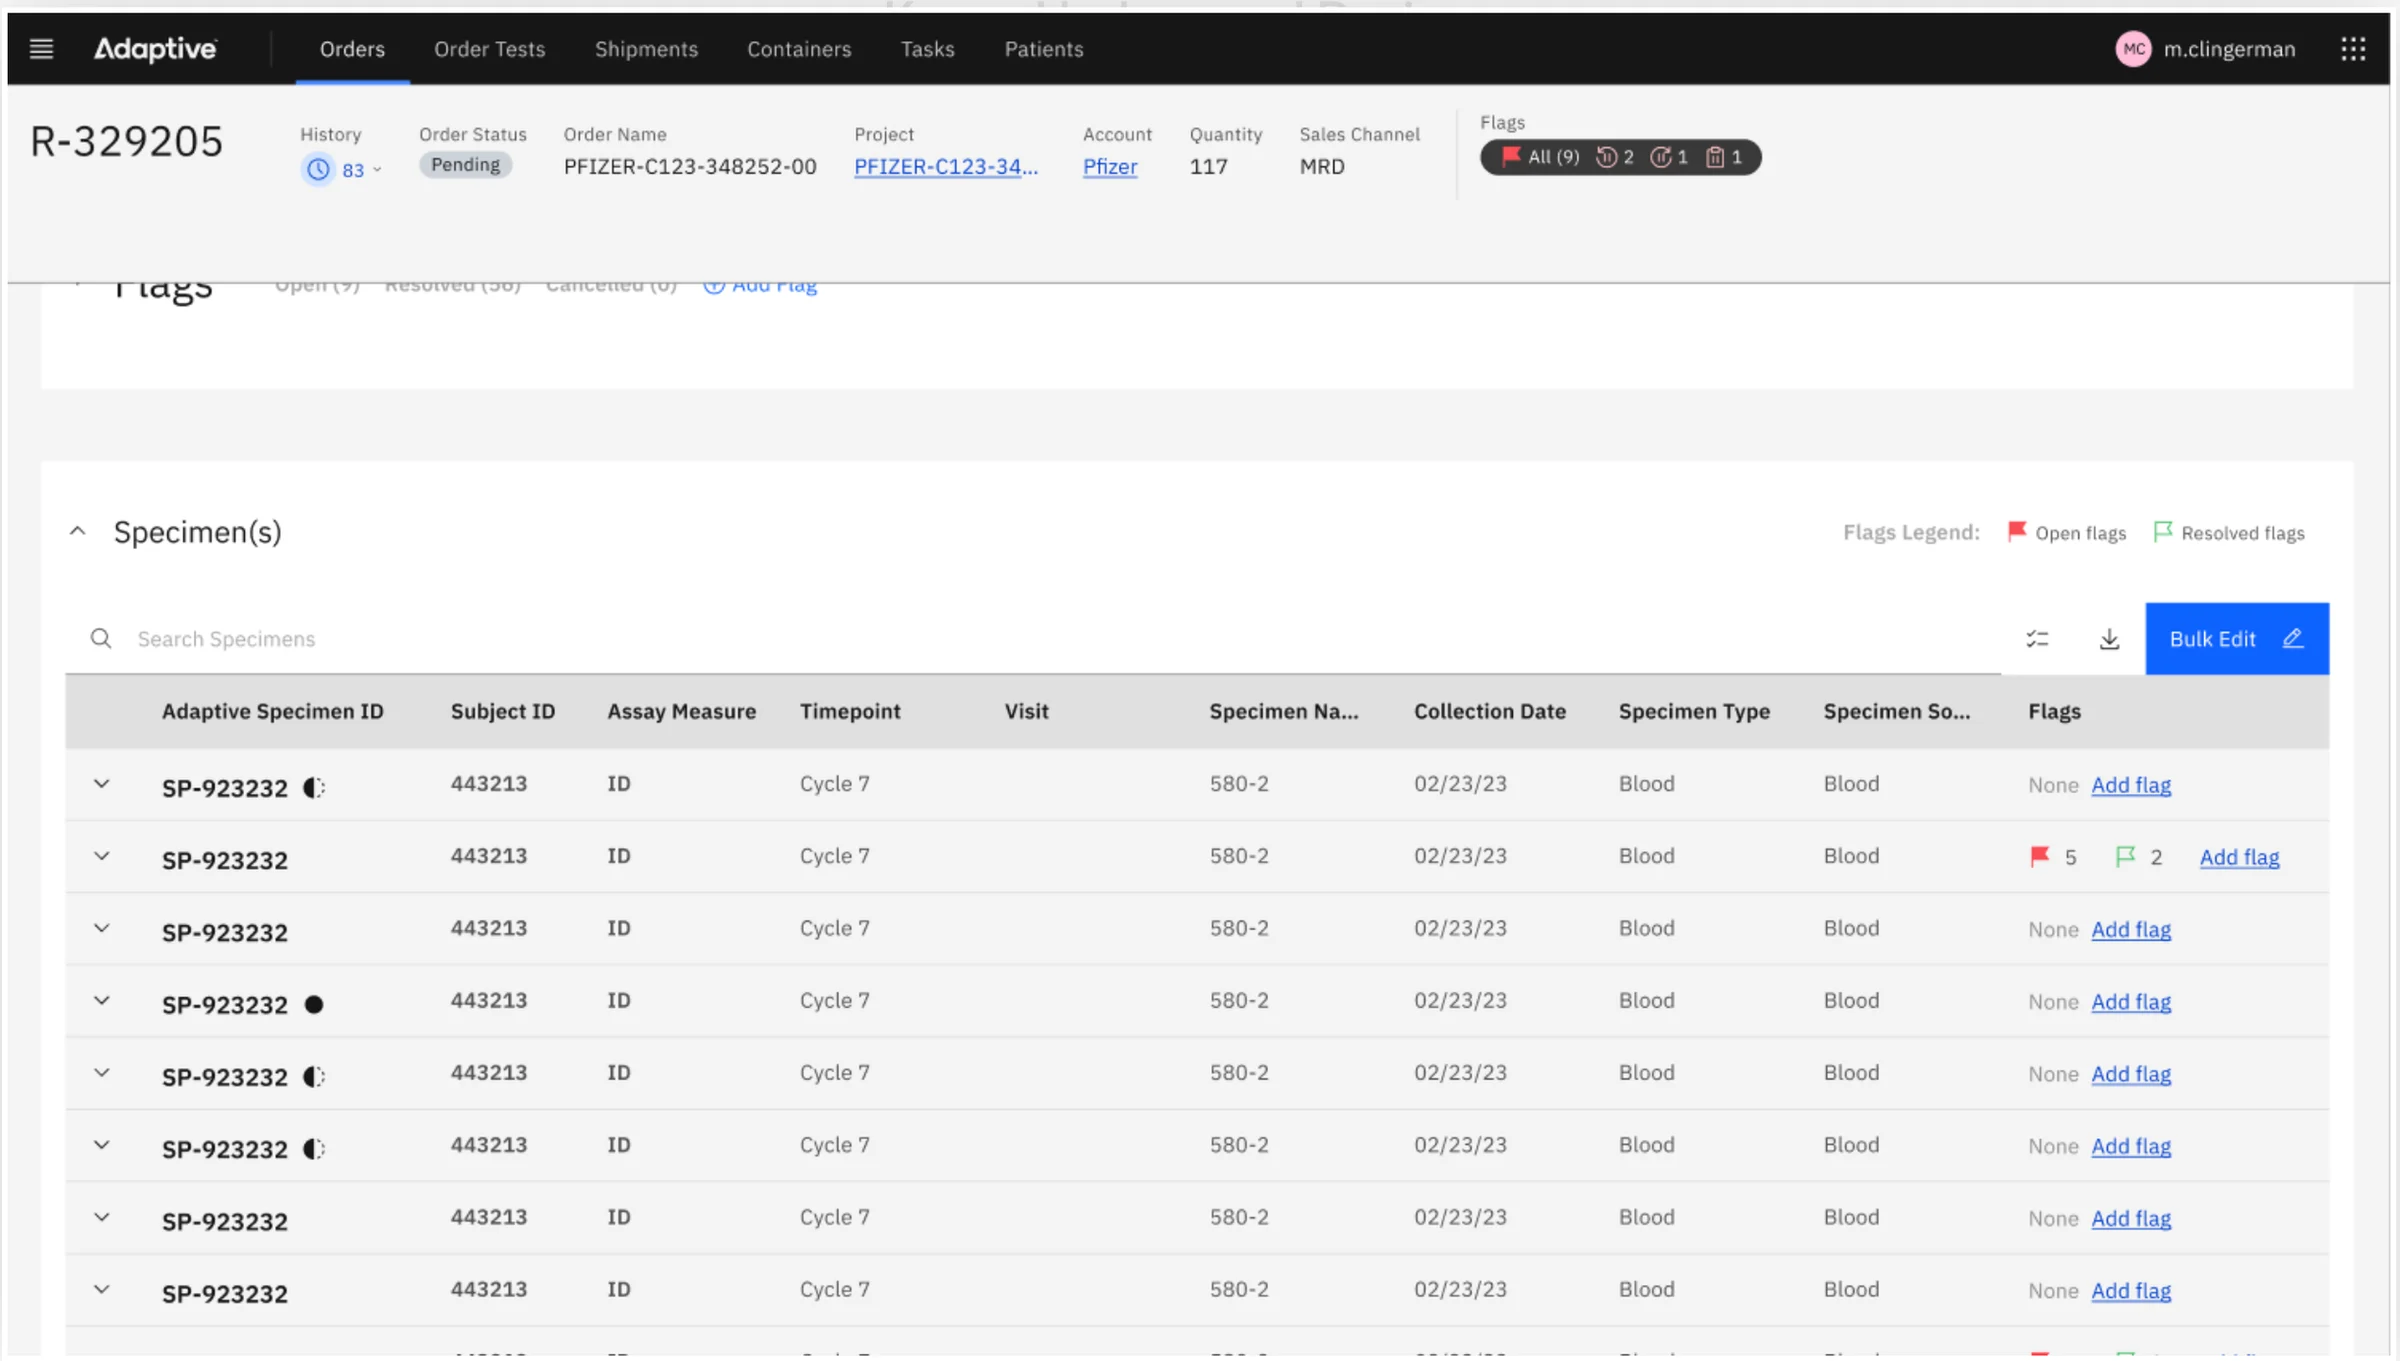
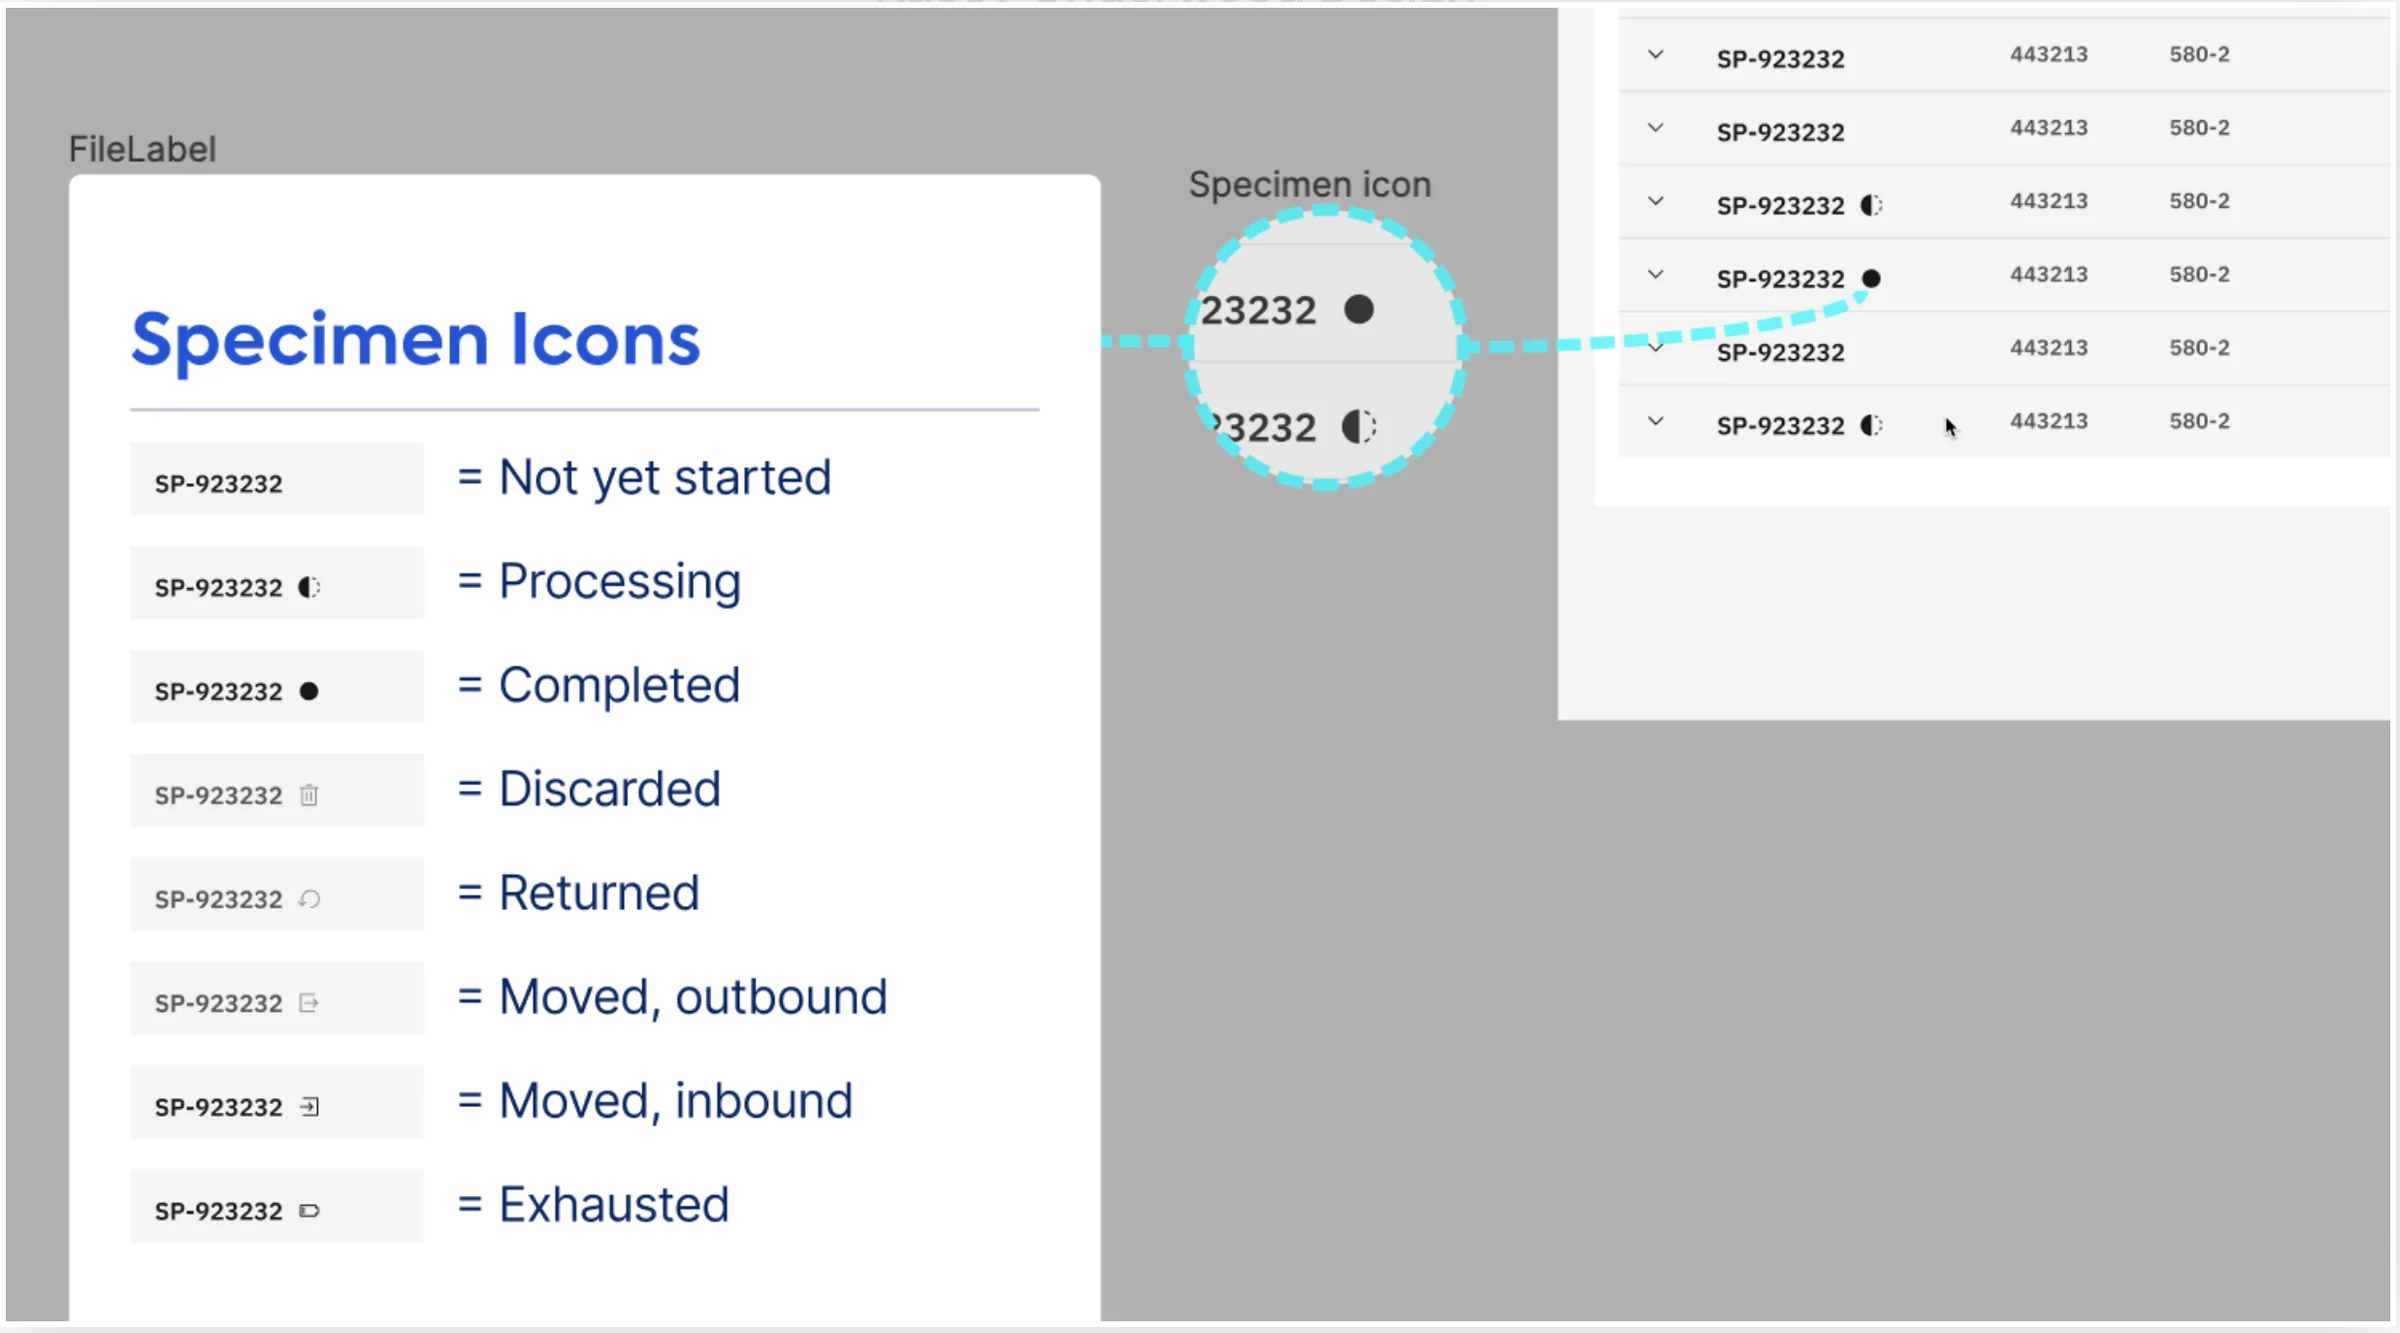
- Status icons. Icons for processing, completed, moved, discarded and returned replace text, which decluttered a text-heavy table.
- A toolbar for scale. Carbon's data table toolbar brings search, filters and batch selection, plus new batch actions the team found specimens needed. These matter most in clinical trial orders, which can hold hundreds of specimens.
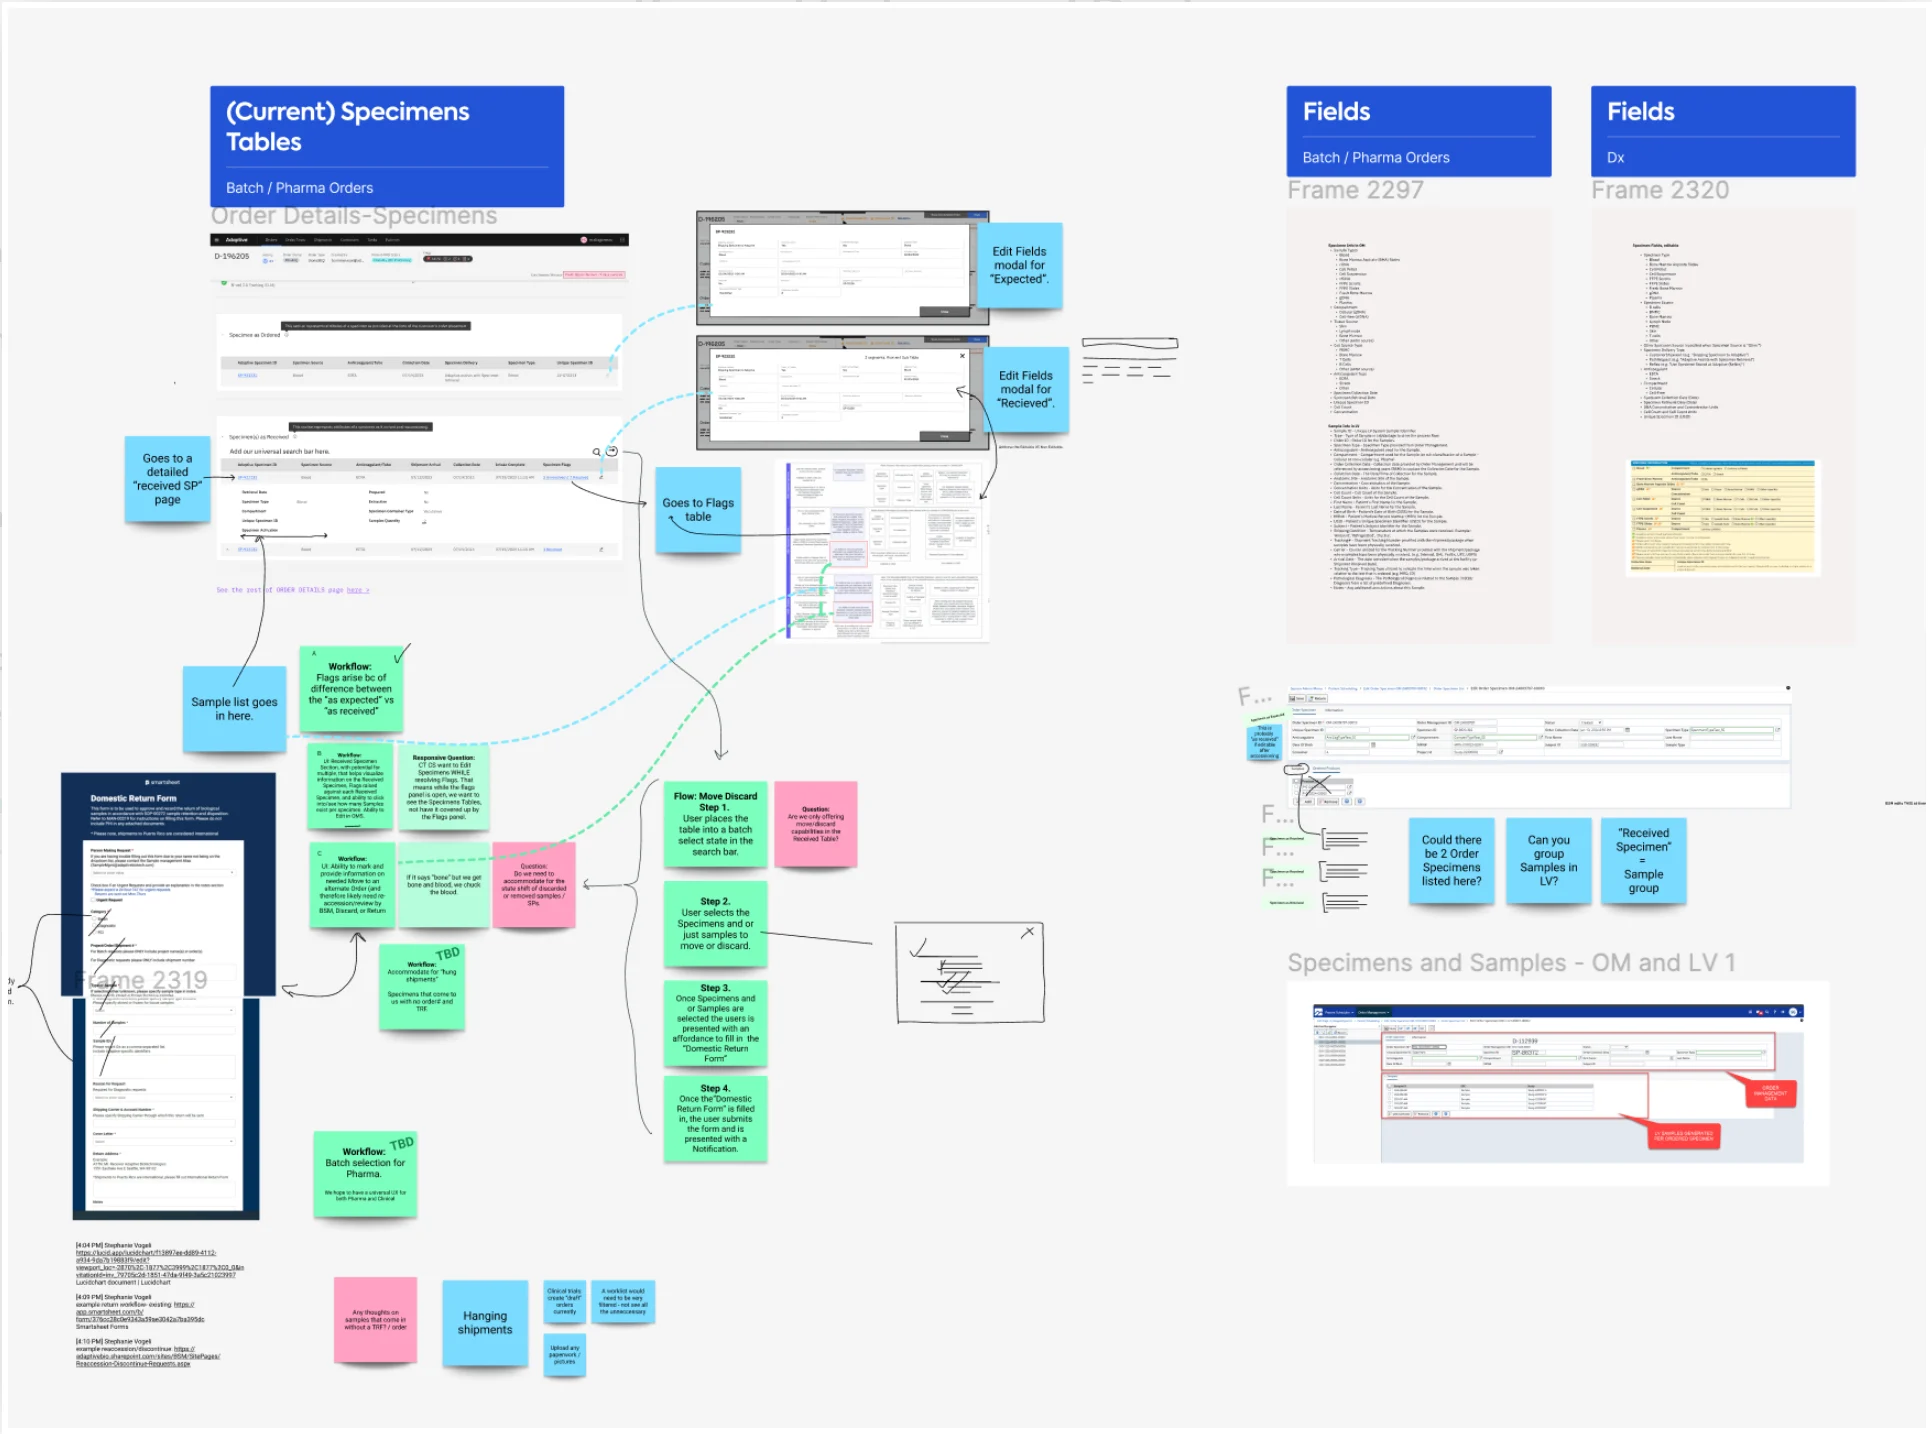
The design started at the whiteboard, with information architecture, workflow definitions and prioritized pain points, then moved through low-fidelity drafts and rapid revisions with the SME panel in Figma.
Dashboards
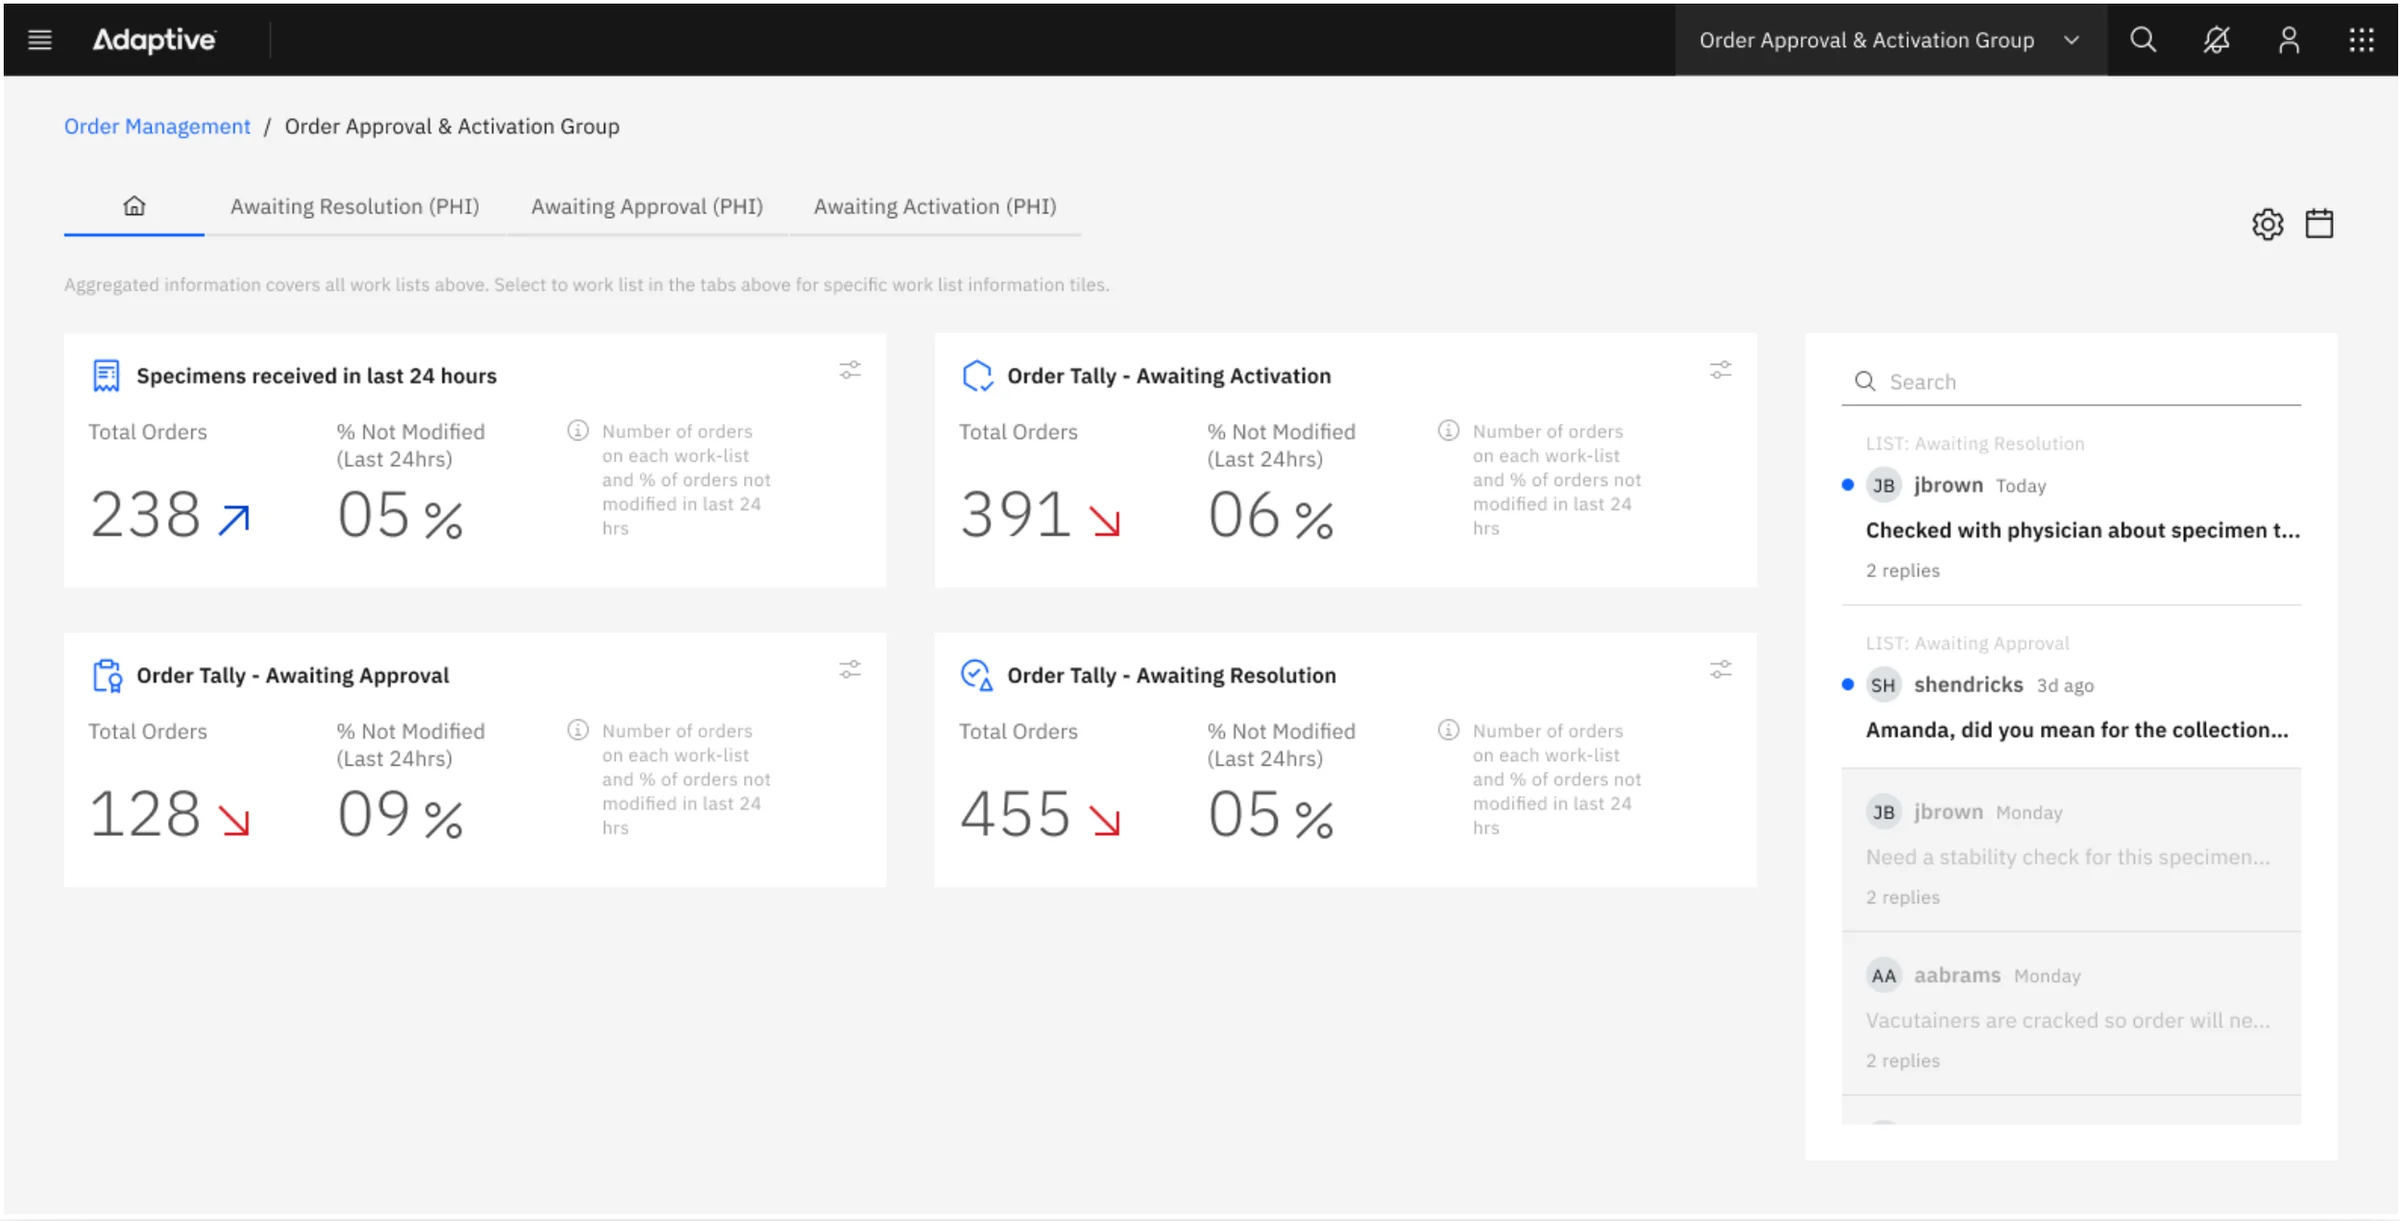
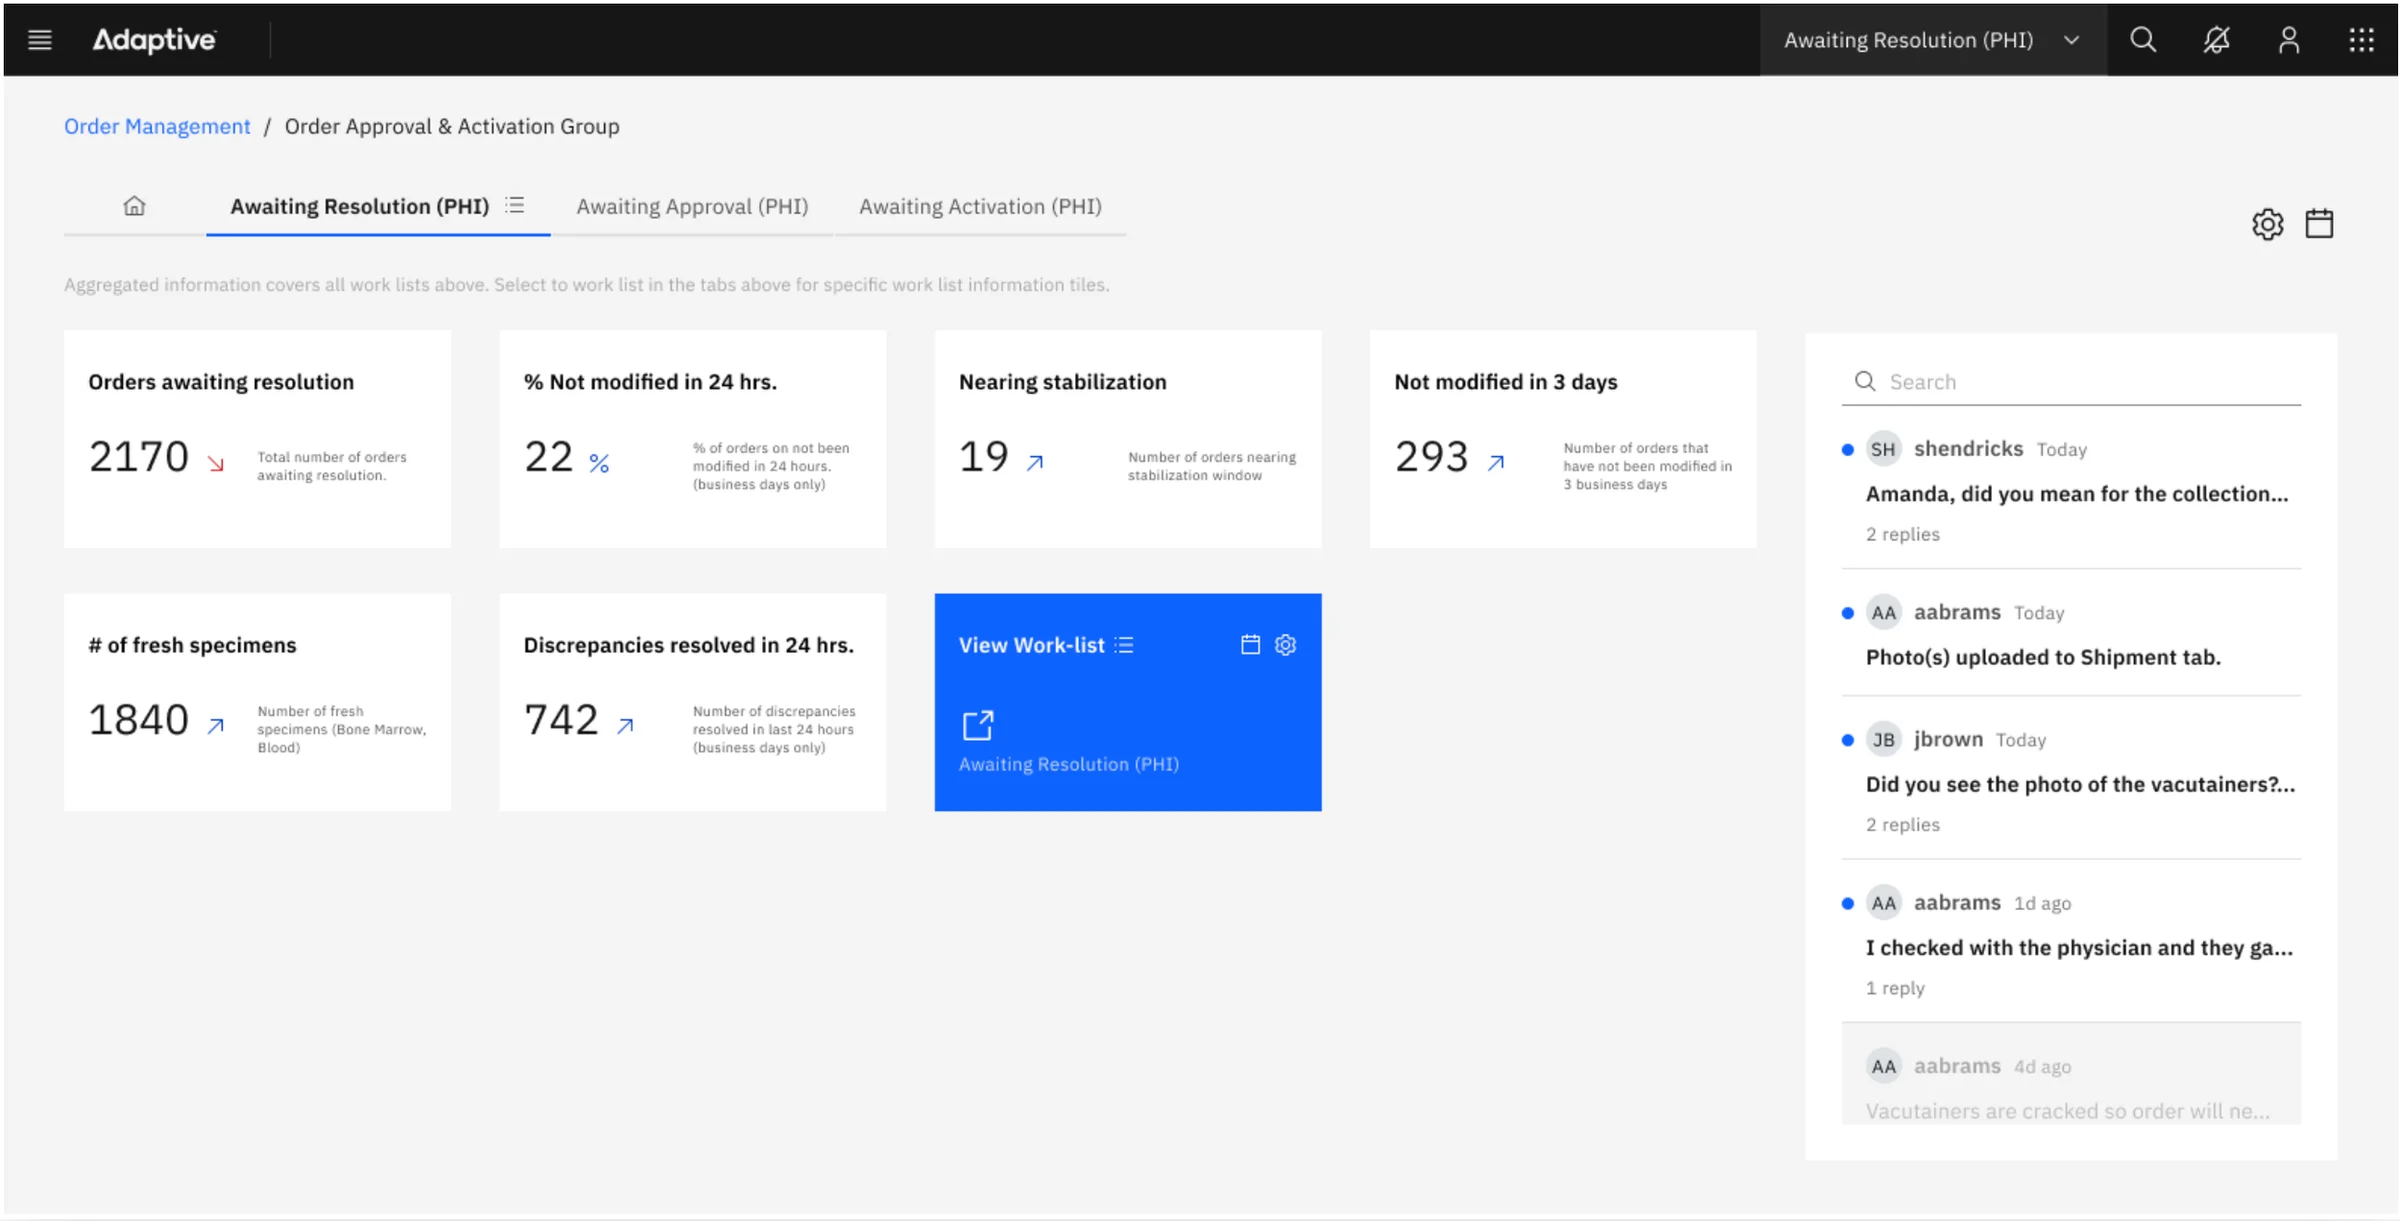
Carbon's data visualization tools made it practical to give teams real insight. The team introduced insight tiles, built on a revised information architecture, for worklists across clinical diagnostics and batch research orders. Each worklist can be queried for questions like:
- How many orders are awaiting resolution?
- What share of the worklist hasn't changed in 24 hours?
- How many orders are nearing stabilization, or may have gone 3 days without a change?
- How many patient orders are MRD-enabled, and how many fresh specimens (bone marrow, blood) are in?
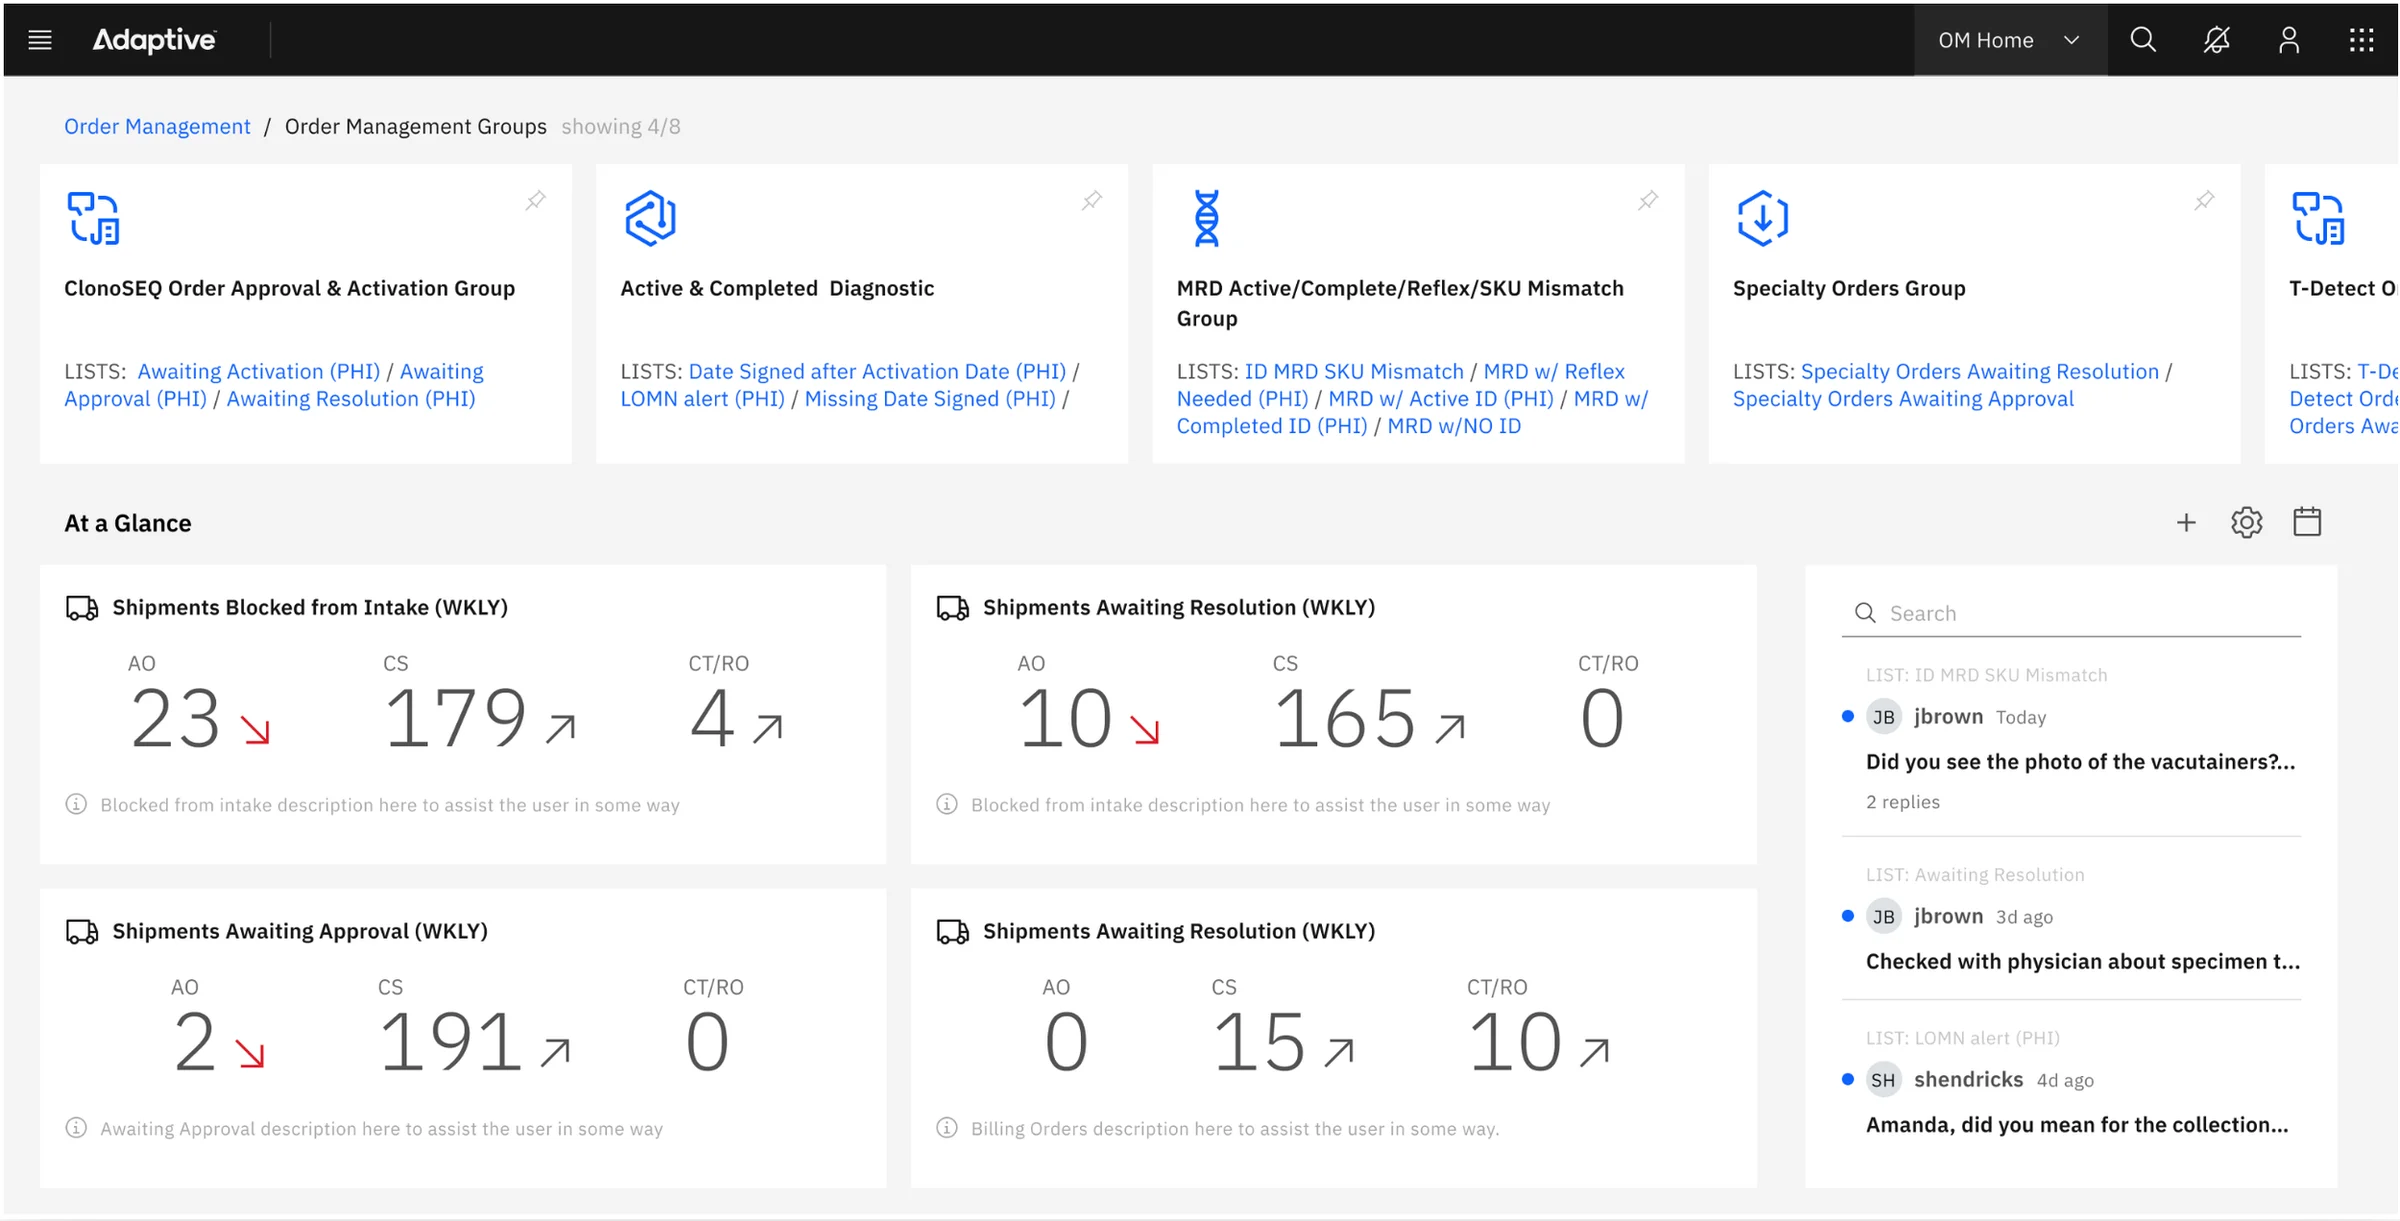
A dashboard homepage shows every worklist group with live analytics, so staff can pick up where they left off and leadership can see team progress. This matters most in the lab, where samples process overnight and assignments and volumes can shift a lot by morning.
What's next
The team explored smart tiles: saved custom queries against specific views, built from the columns a user cares about, that update order metadata live and can be shared, giving leadership better reporting for decisions and planning.
Skills: Information Architecture, UX Design, Data Visualization, Design Systems, Healthcare UX.