HealthTech, Enterprise UX, Design Systems
Adaptive Part 2: Reducing Cognitive Load in Order Management
Analysts insisted on seeing every field. Chunked detail pages, a Flags panel, purposeful data tables and scoped search let them keep it all while the screens got calmer.
Adaptive Biotechnologies

- 01 Problem
Order Management pages were long and dense, and the SME panel wanted every field kept. Issues on an order had to be tracked down across notes, calls, emails and other systems, and list screens loaded every record before anyone could filter.
- 02 Approach
Group fields into headed chunks, contain every issue in a Flags panel that stays open beside the page, design data tables around how experts already read spreadsheets, and open lists empty until search and filters scope them.
- 03 Outcome
Detail pages that scan quickly without losing a field, one place to see and resolve anything holding up an order, and list screens that load fast and show only what a workflow needs.
Chunking dense pages
Flags
Data tables and search
From low fidelity to Figma
Project summary
This is Part 2 of the Adaptive Order Management story. Part 1 found that analysts' jobs were detailed and in the weeds, and that every field on a page mattered to someone. This part shows how the team reduced cognitive load without removing content. Part 3 covers the patient-centered architecture, specimen tables and dashboards.
Chunking dense pages
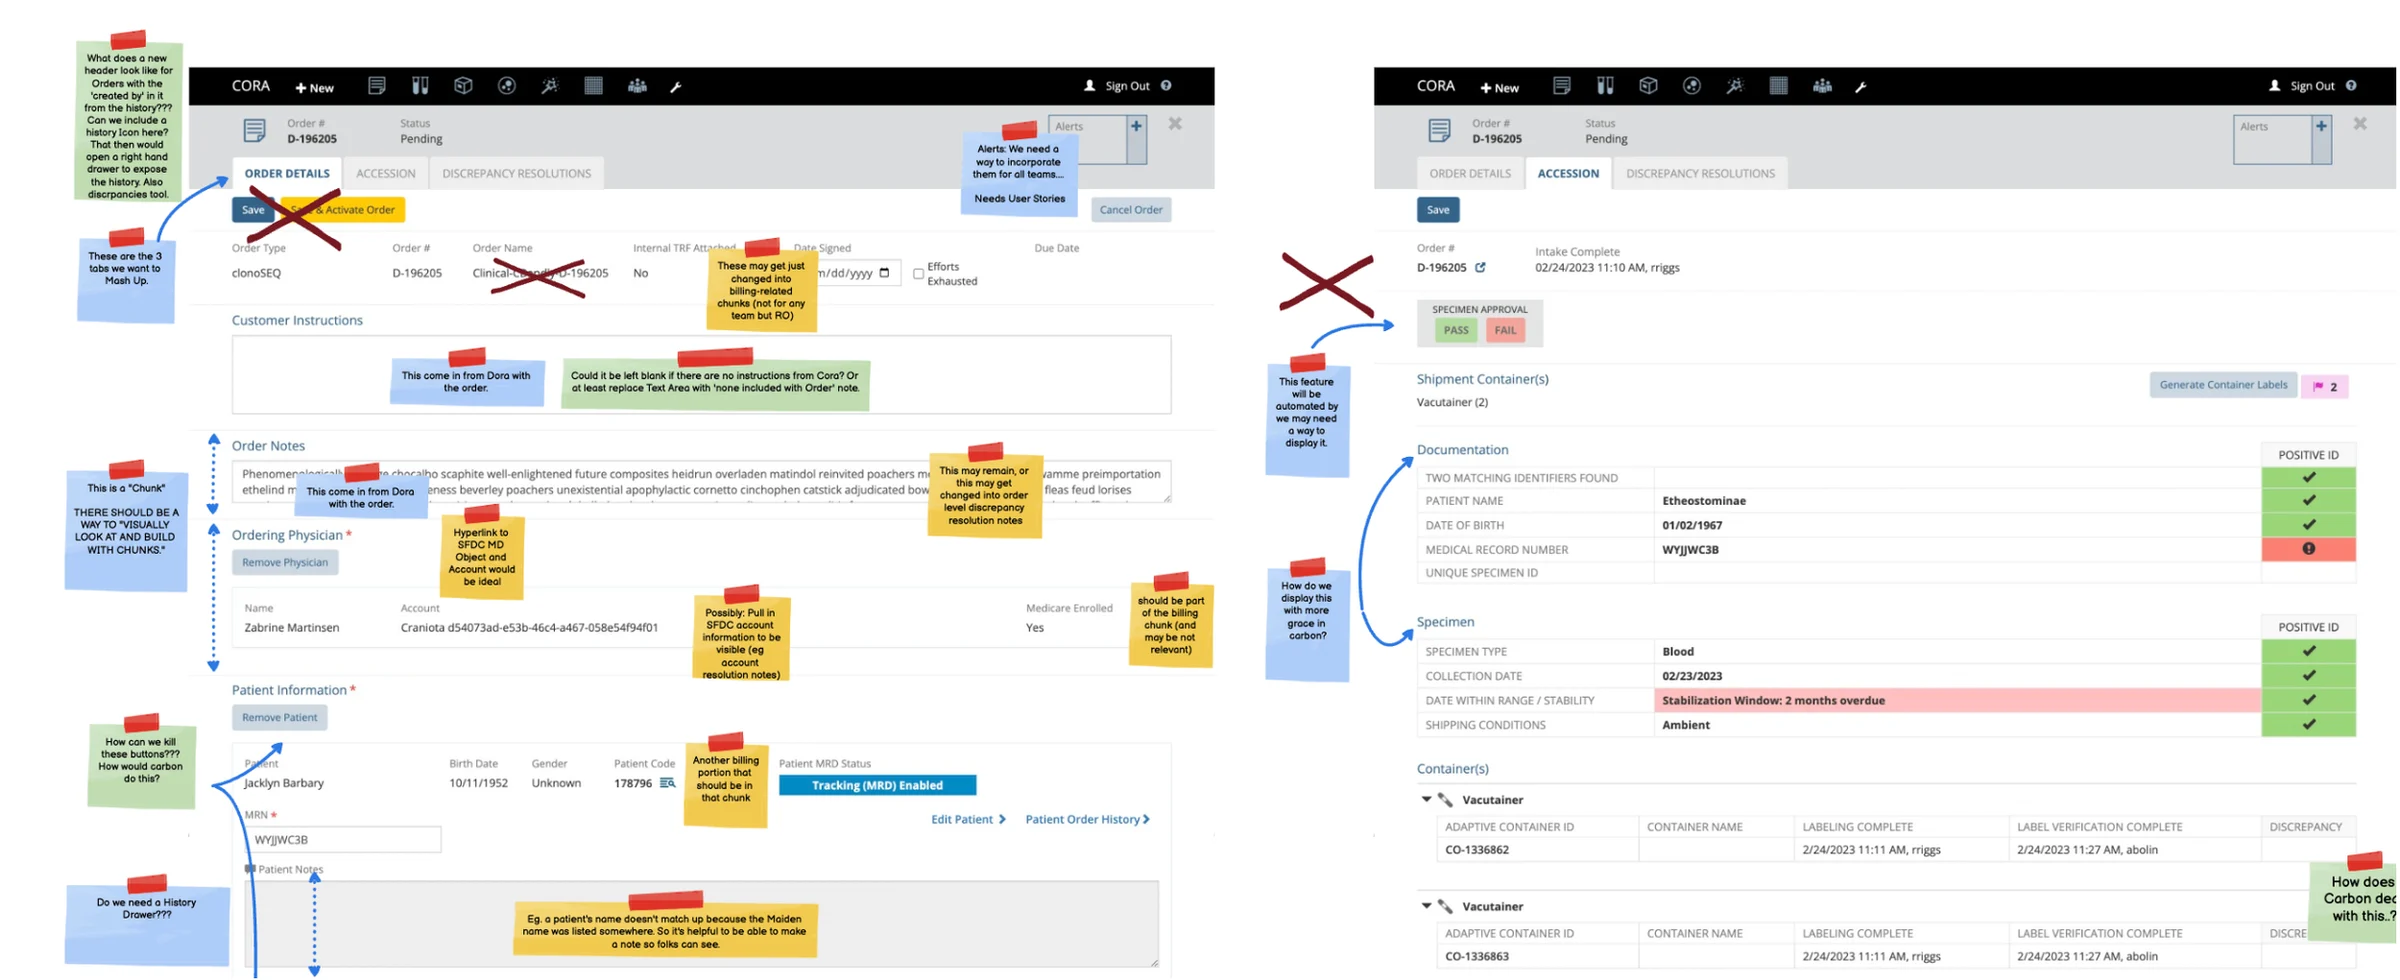
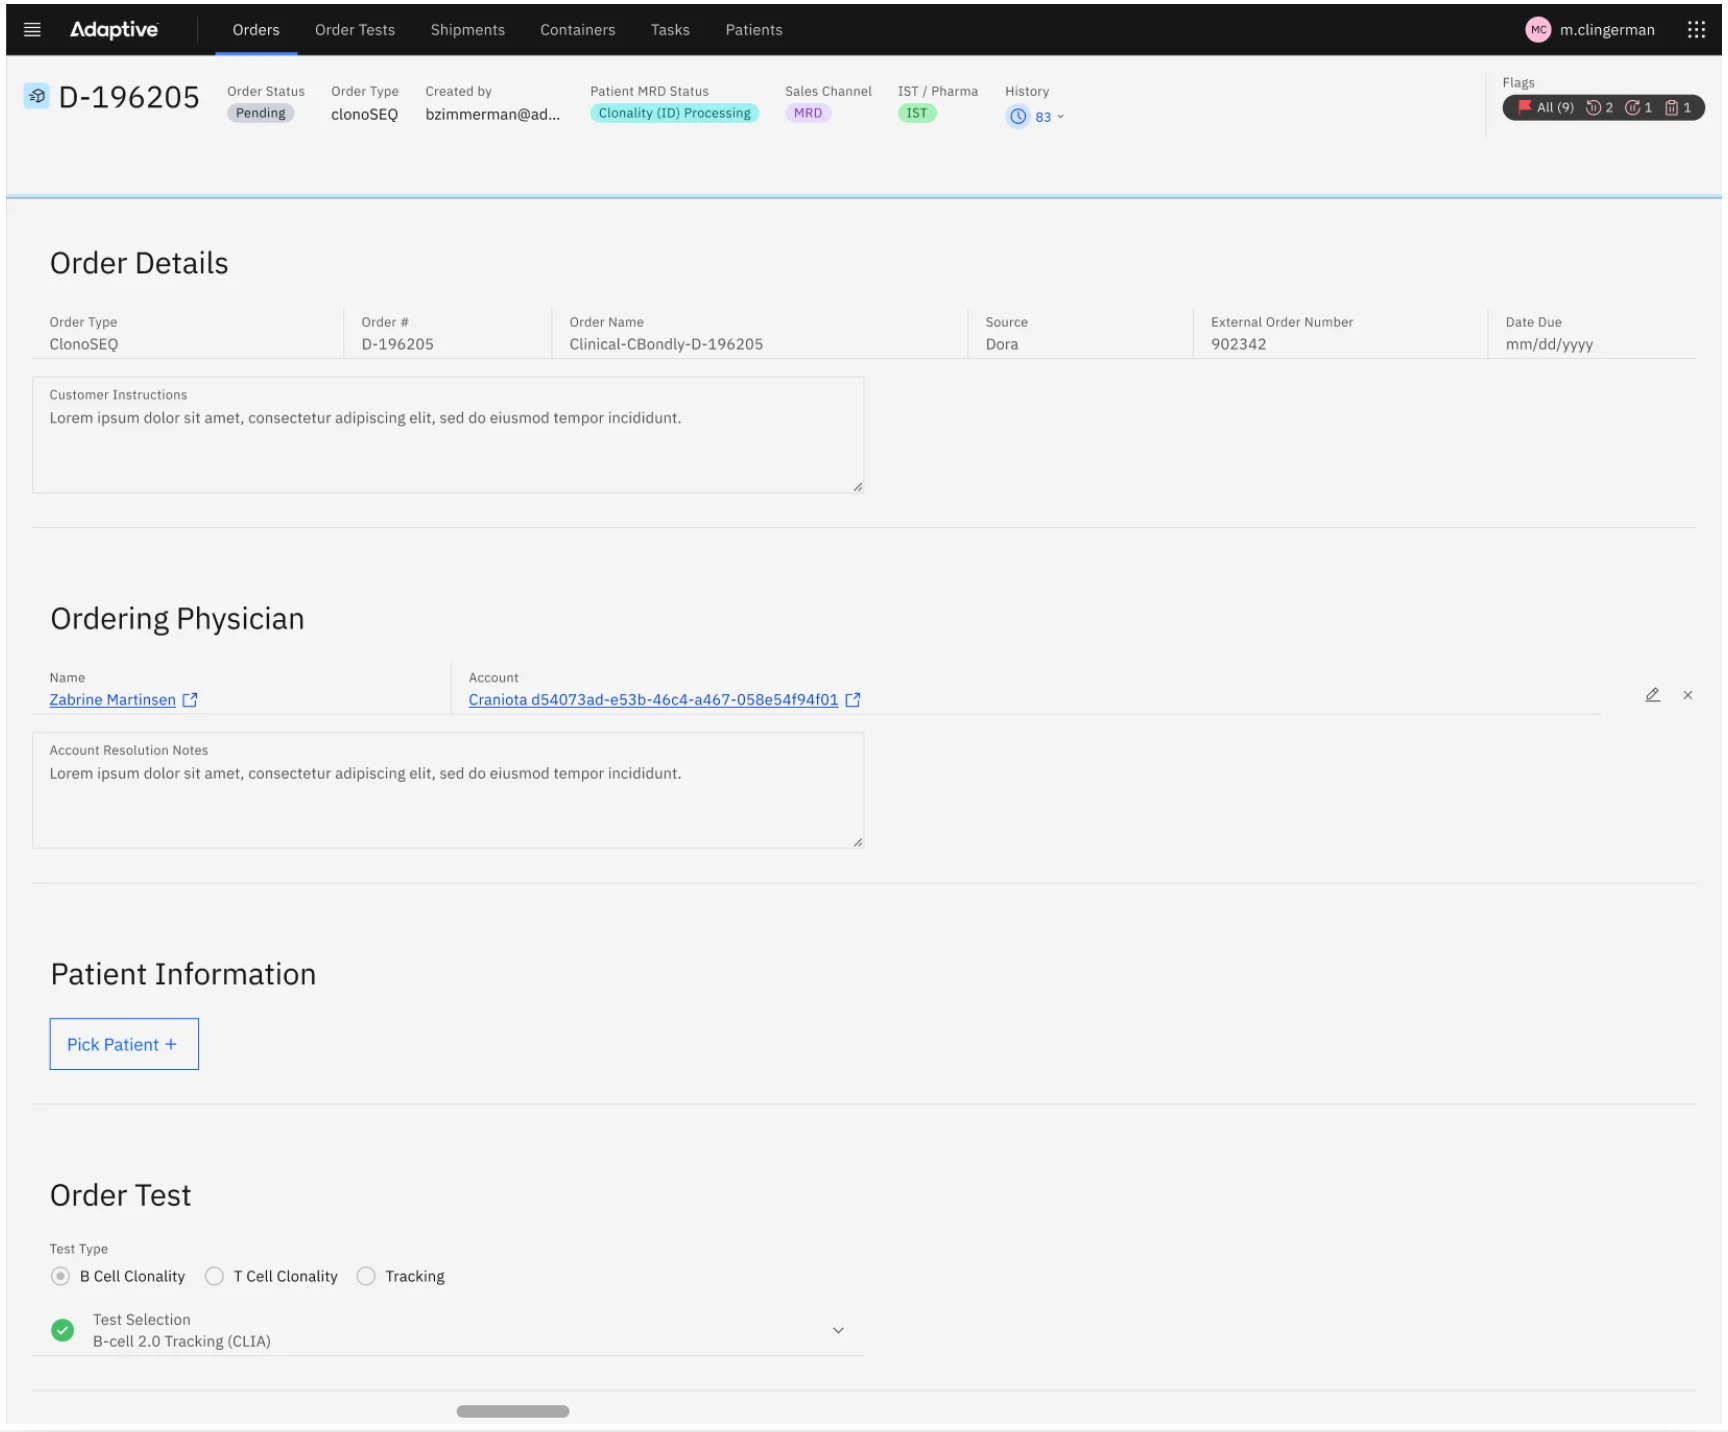
The SME panel asked for long pages with a lot of information at their fingertips. Rather than cut fields, the team grouped related fields together and gave each group a heading, then applied the same chunking to every details screen: Order Details, Patient Details, Project Details and Subject Details. Nielsen Norman Group's research supports the approach: chunked content is easier to scan, understand and remember.
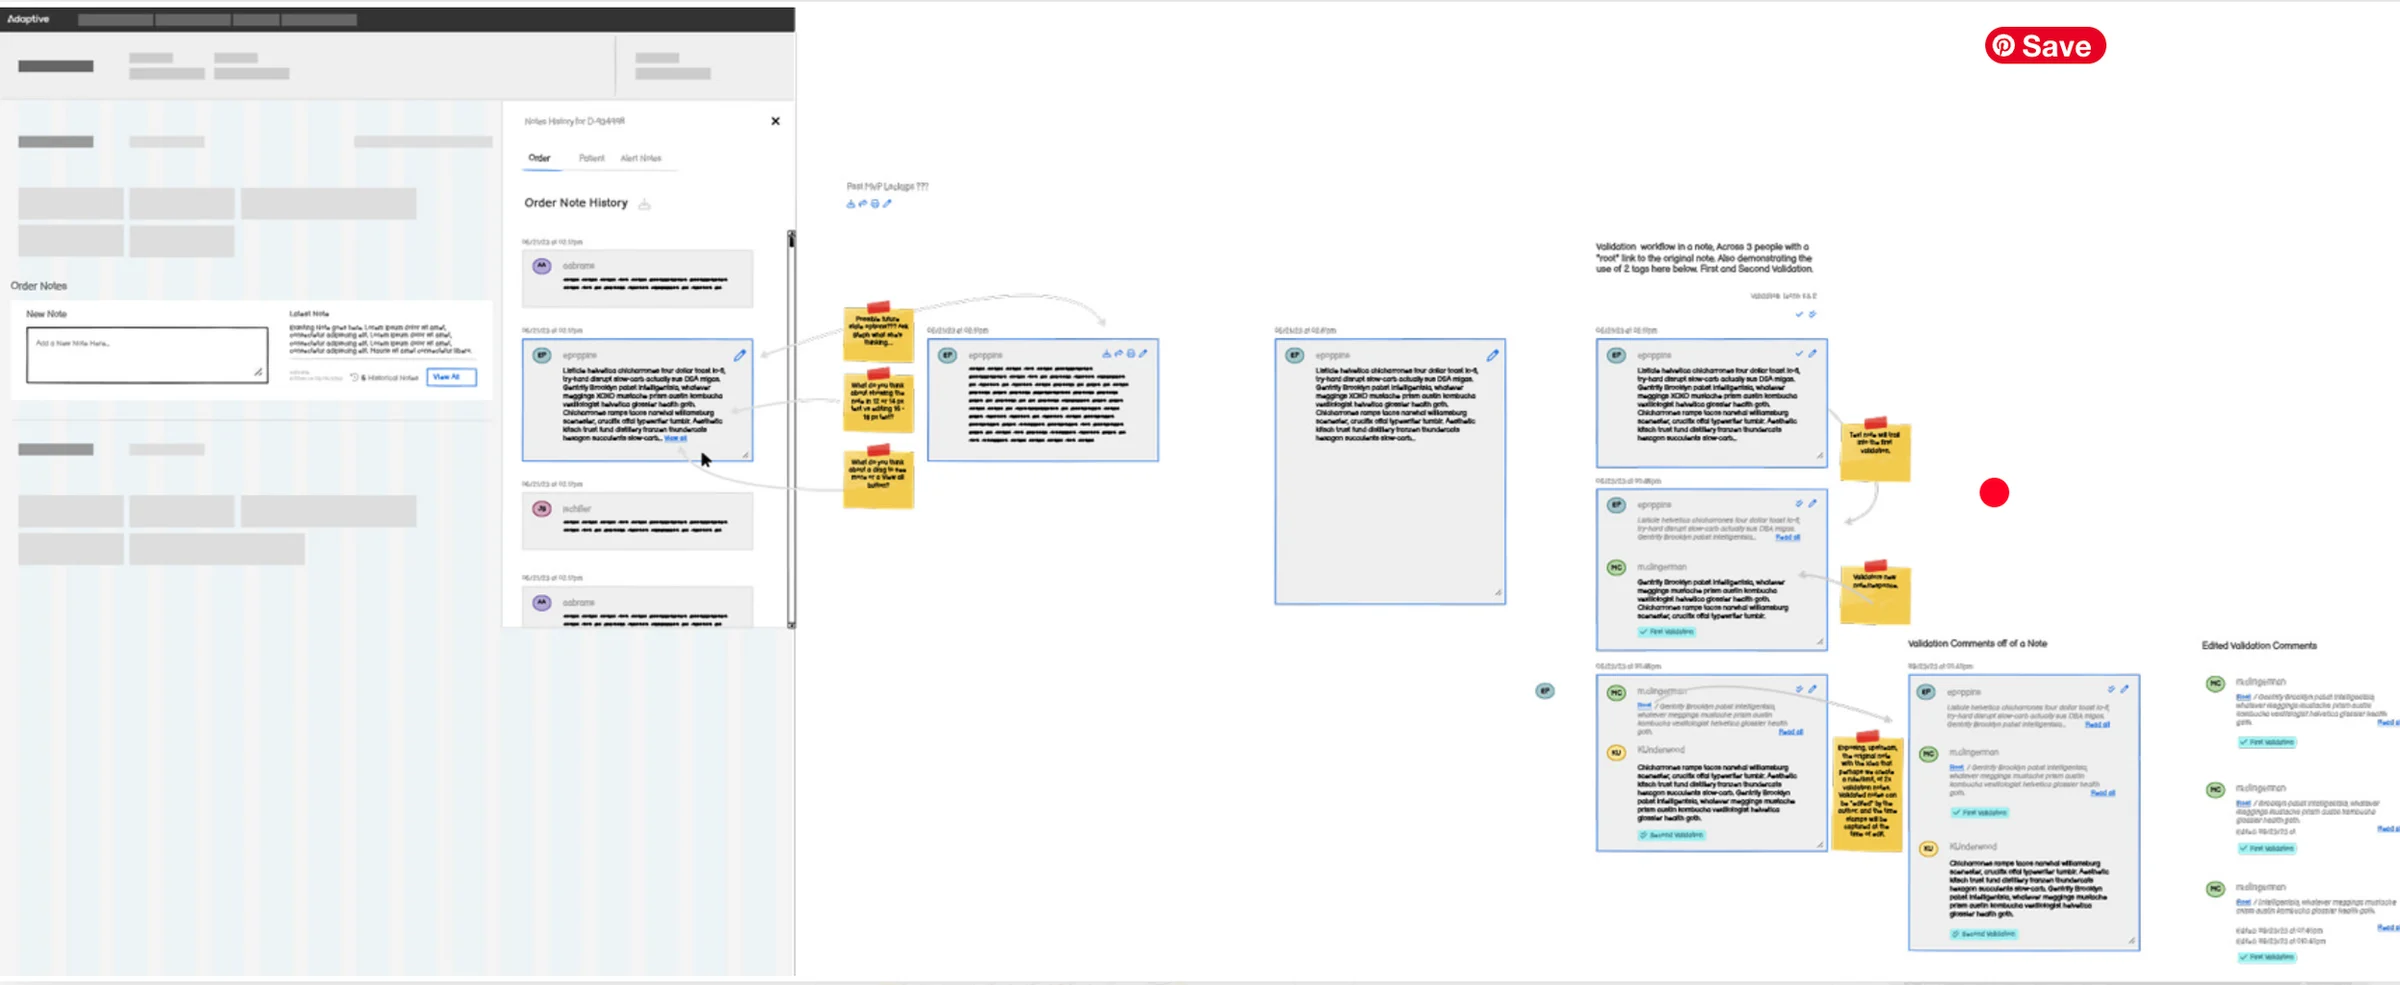
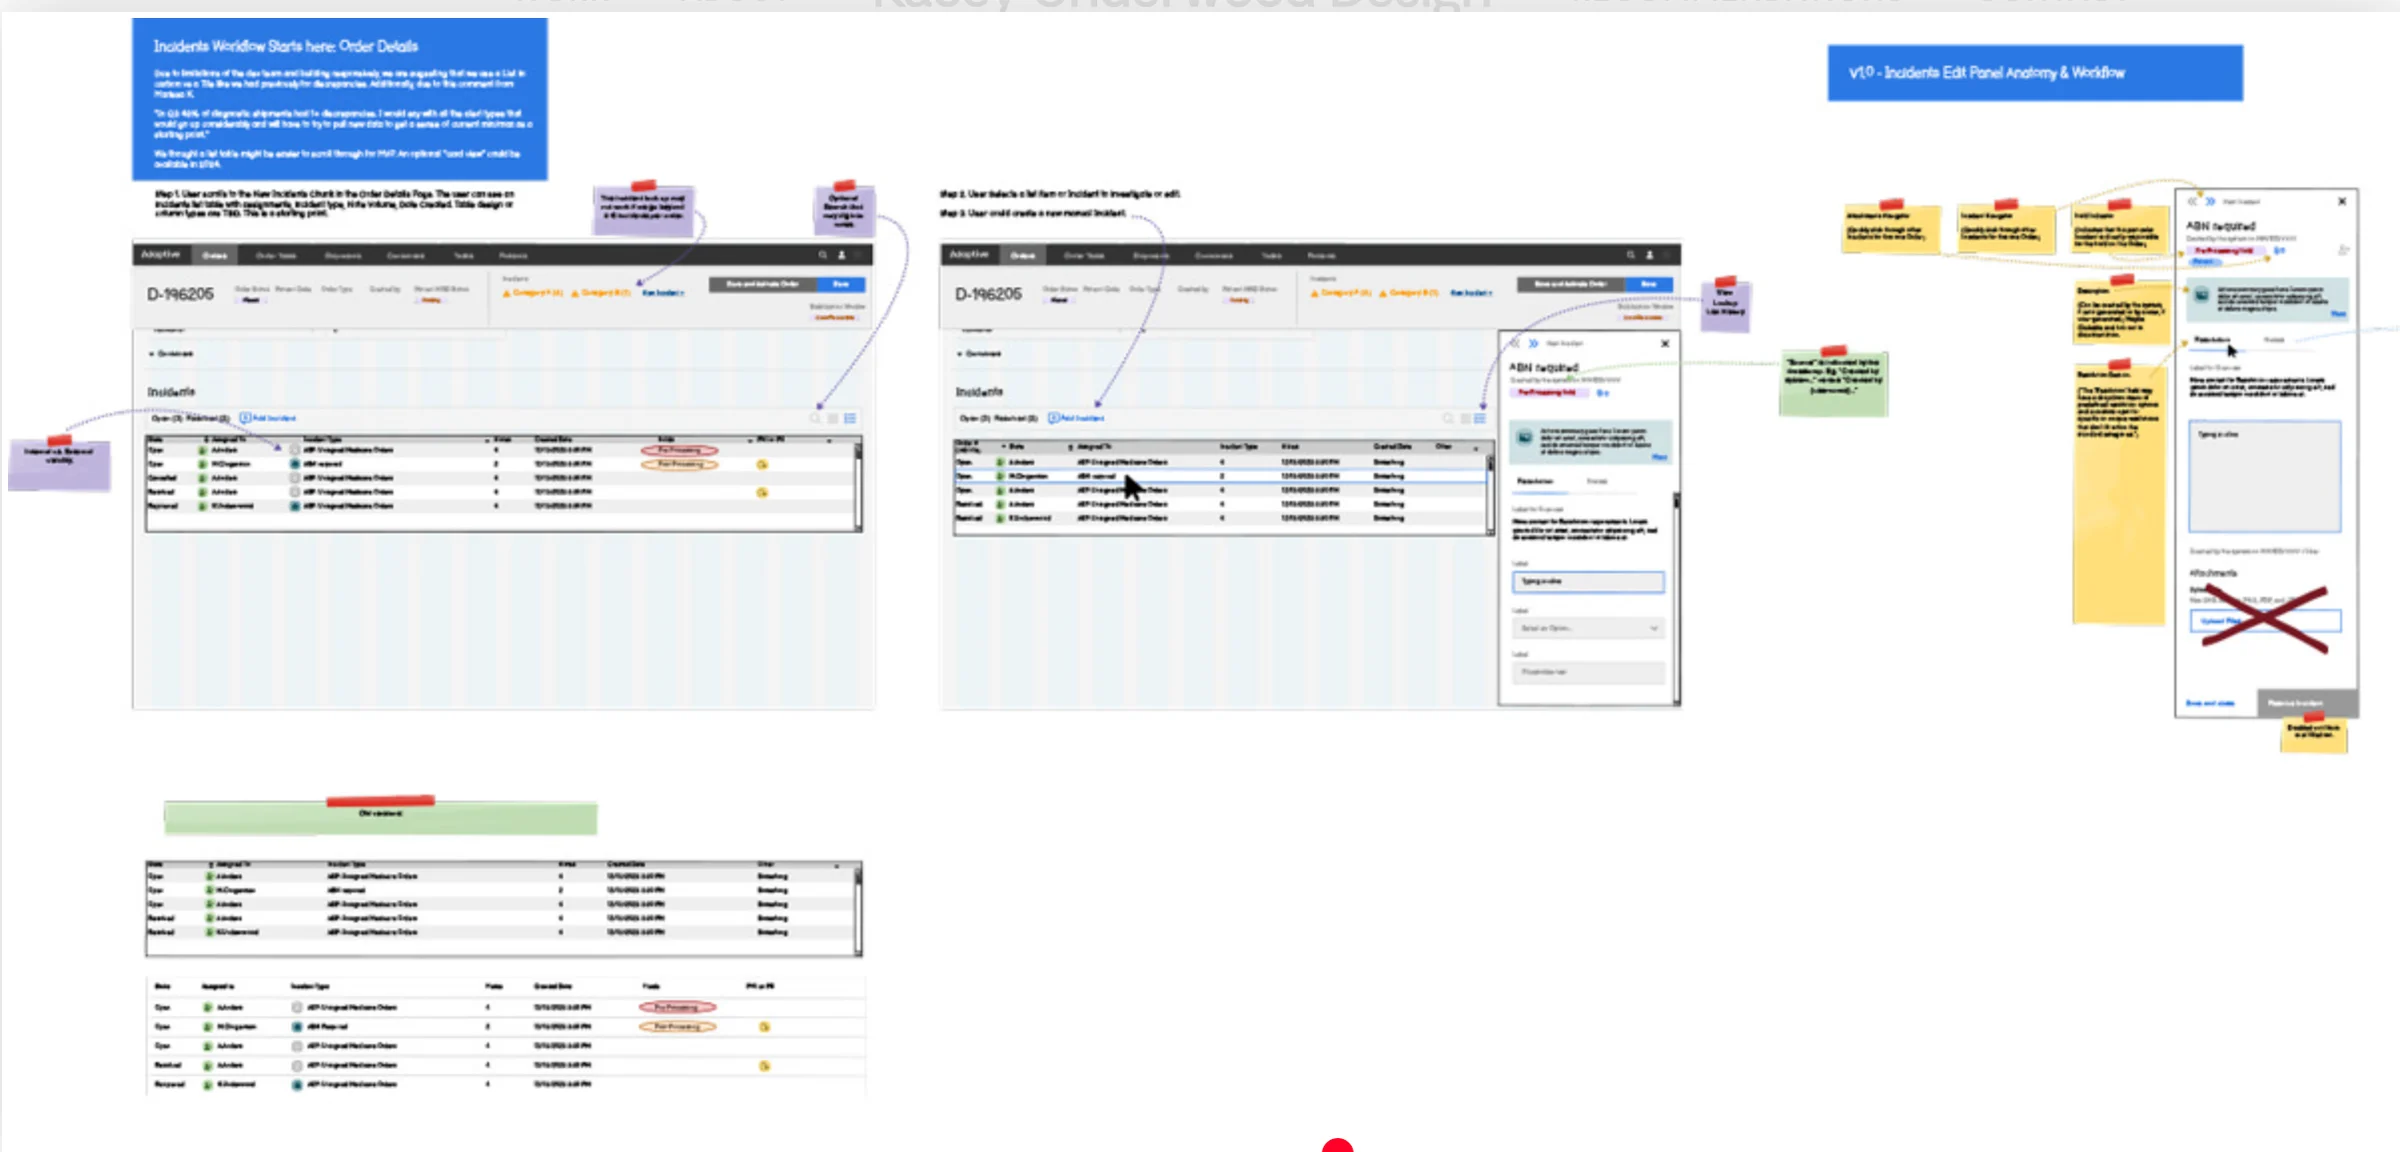
The chunks were defined in low fidelity first, with sticky notes and labels to capture ideas and context with the SMEs as they talked, then carried into high-fidelity Order Details designs.
Flags
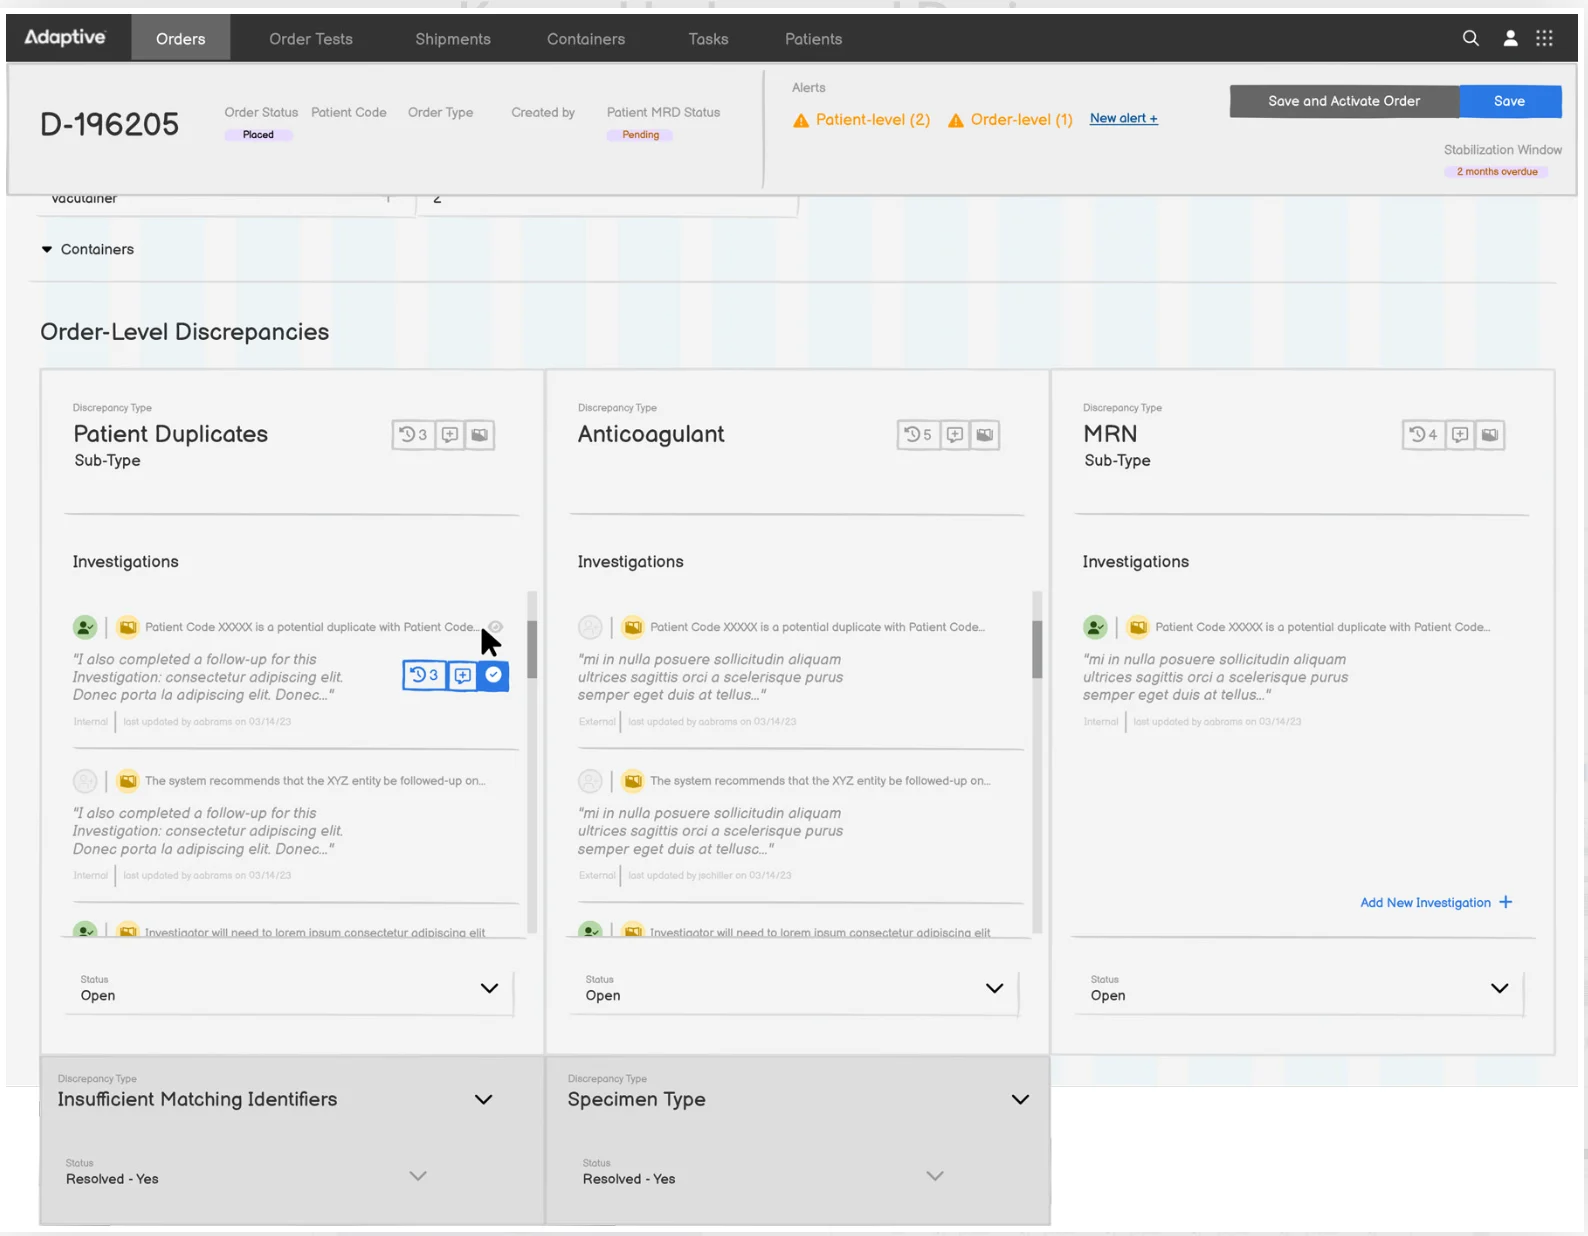
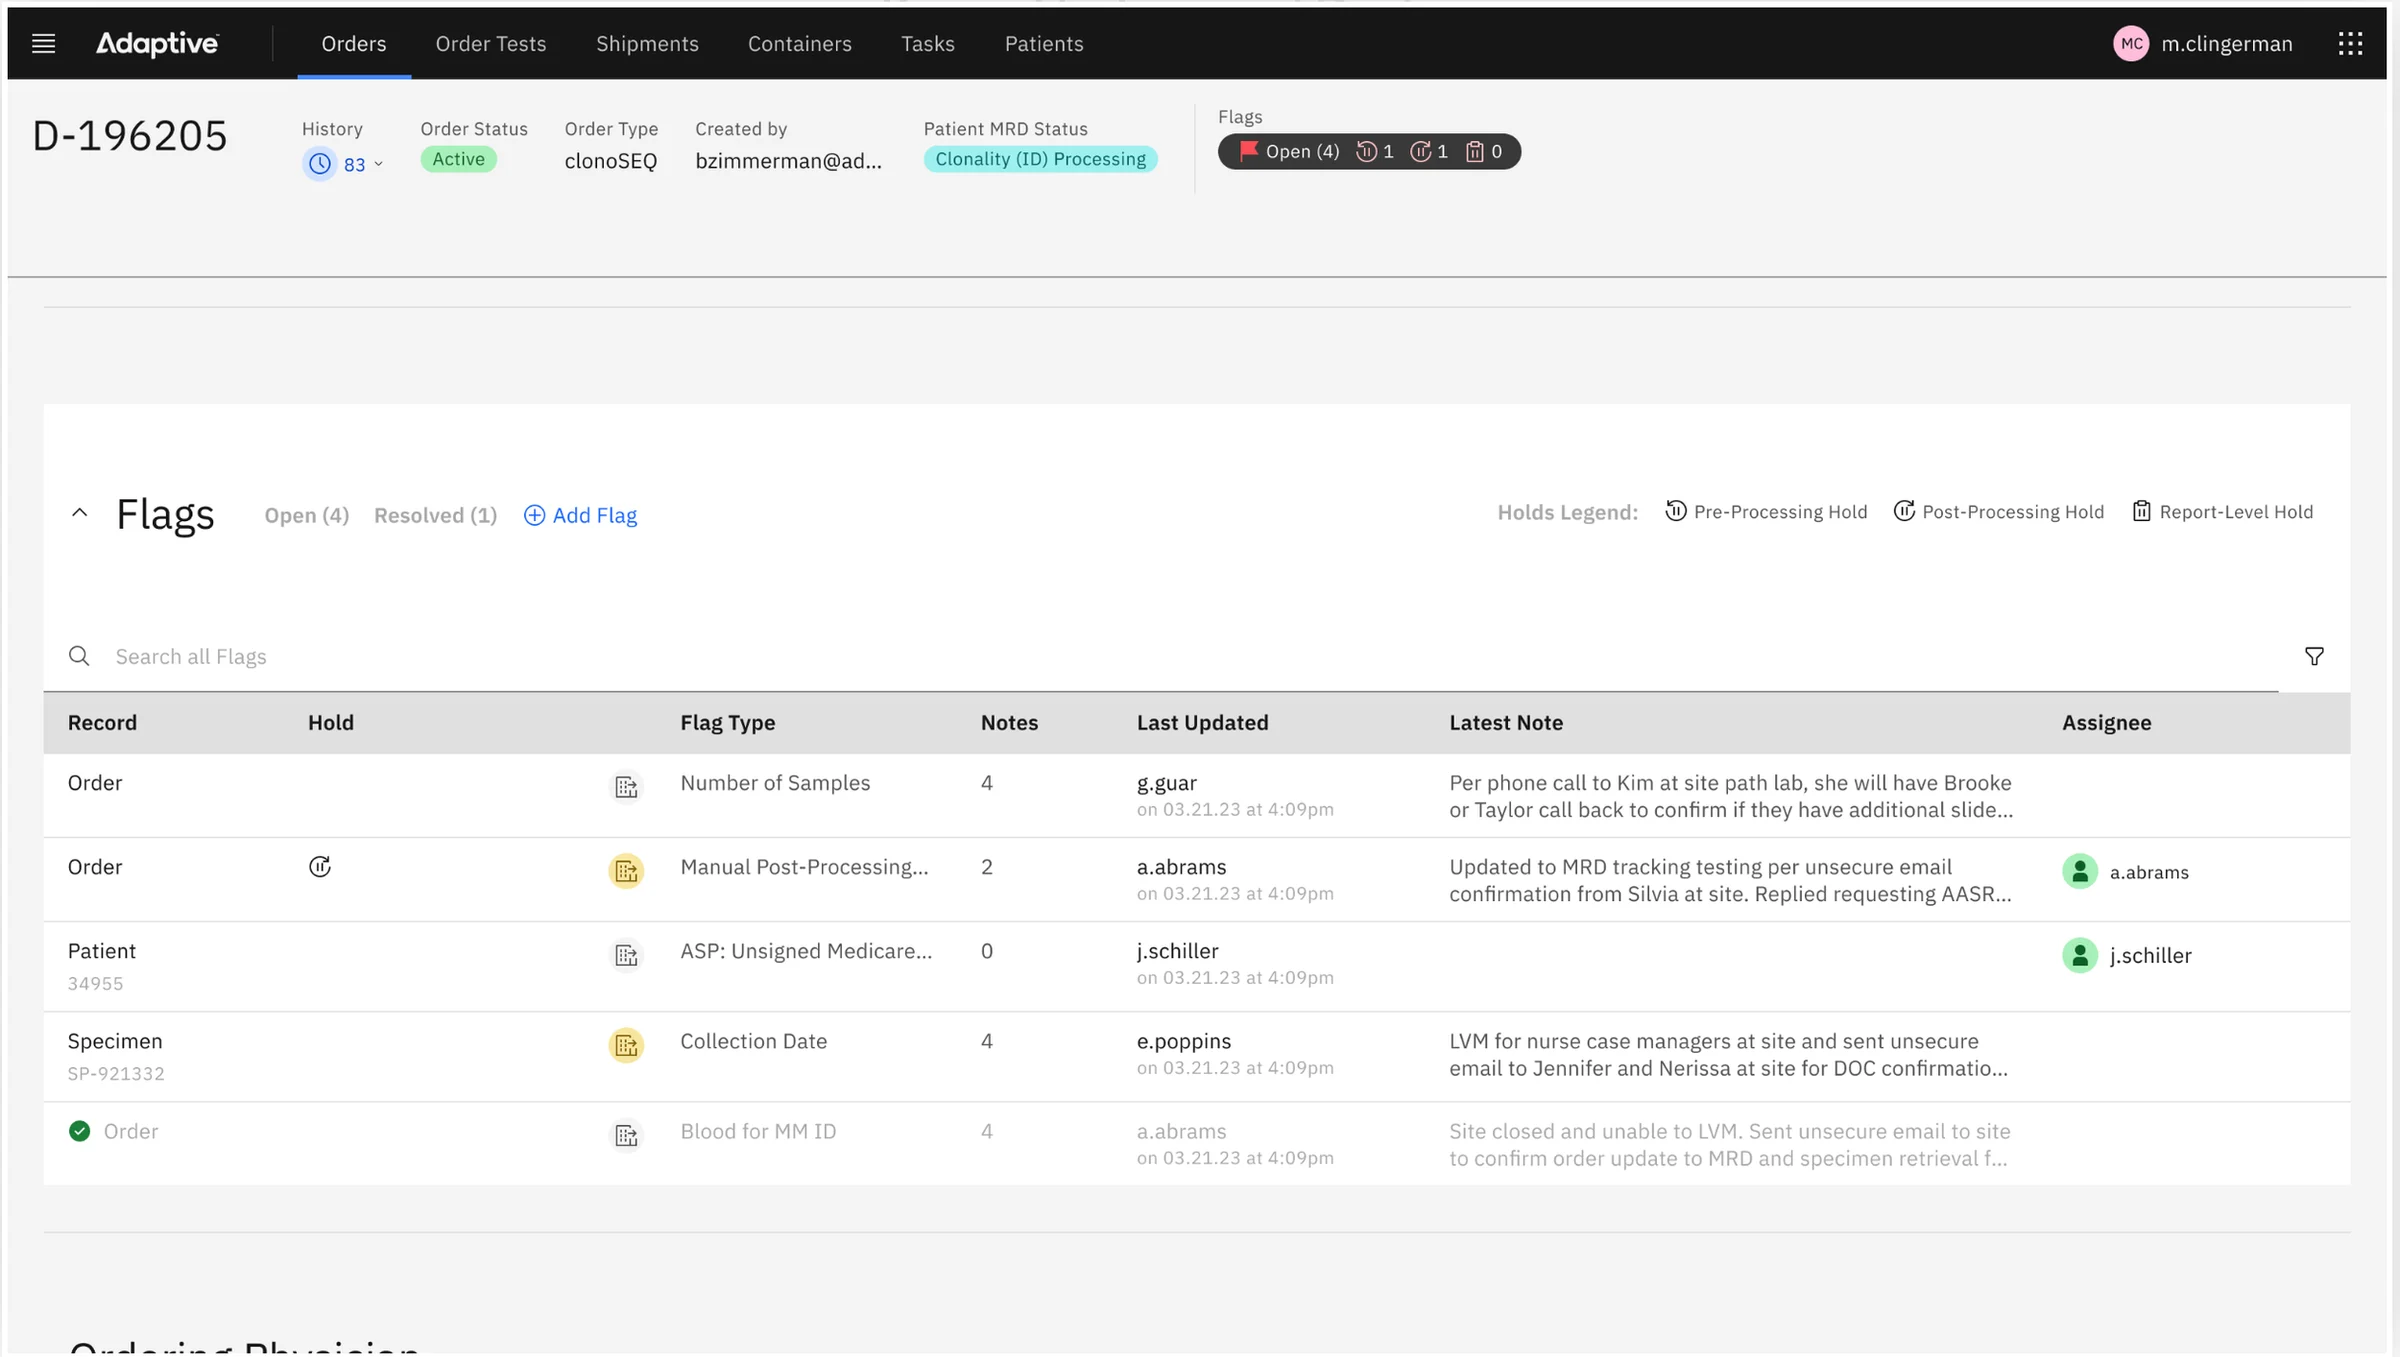
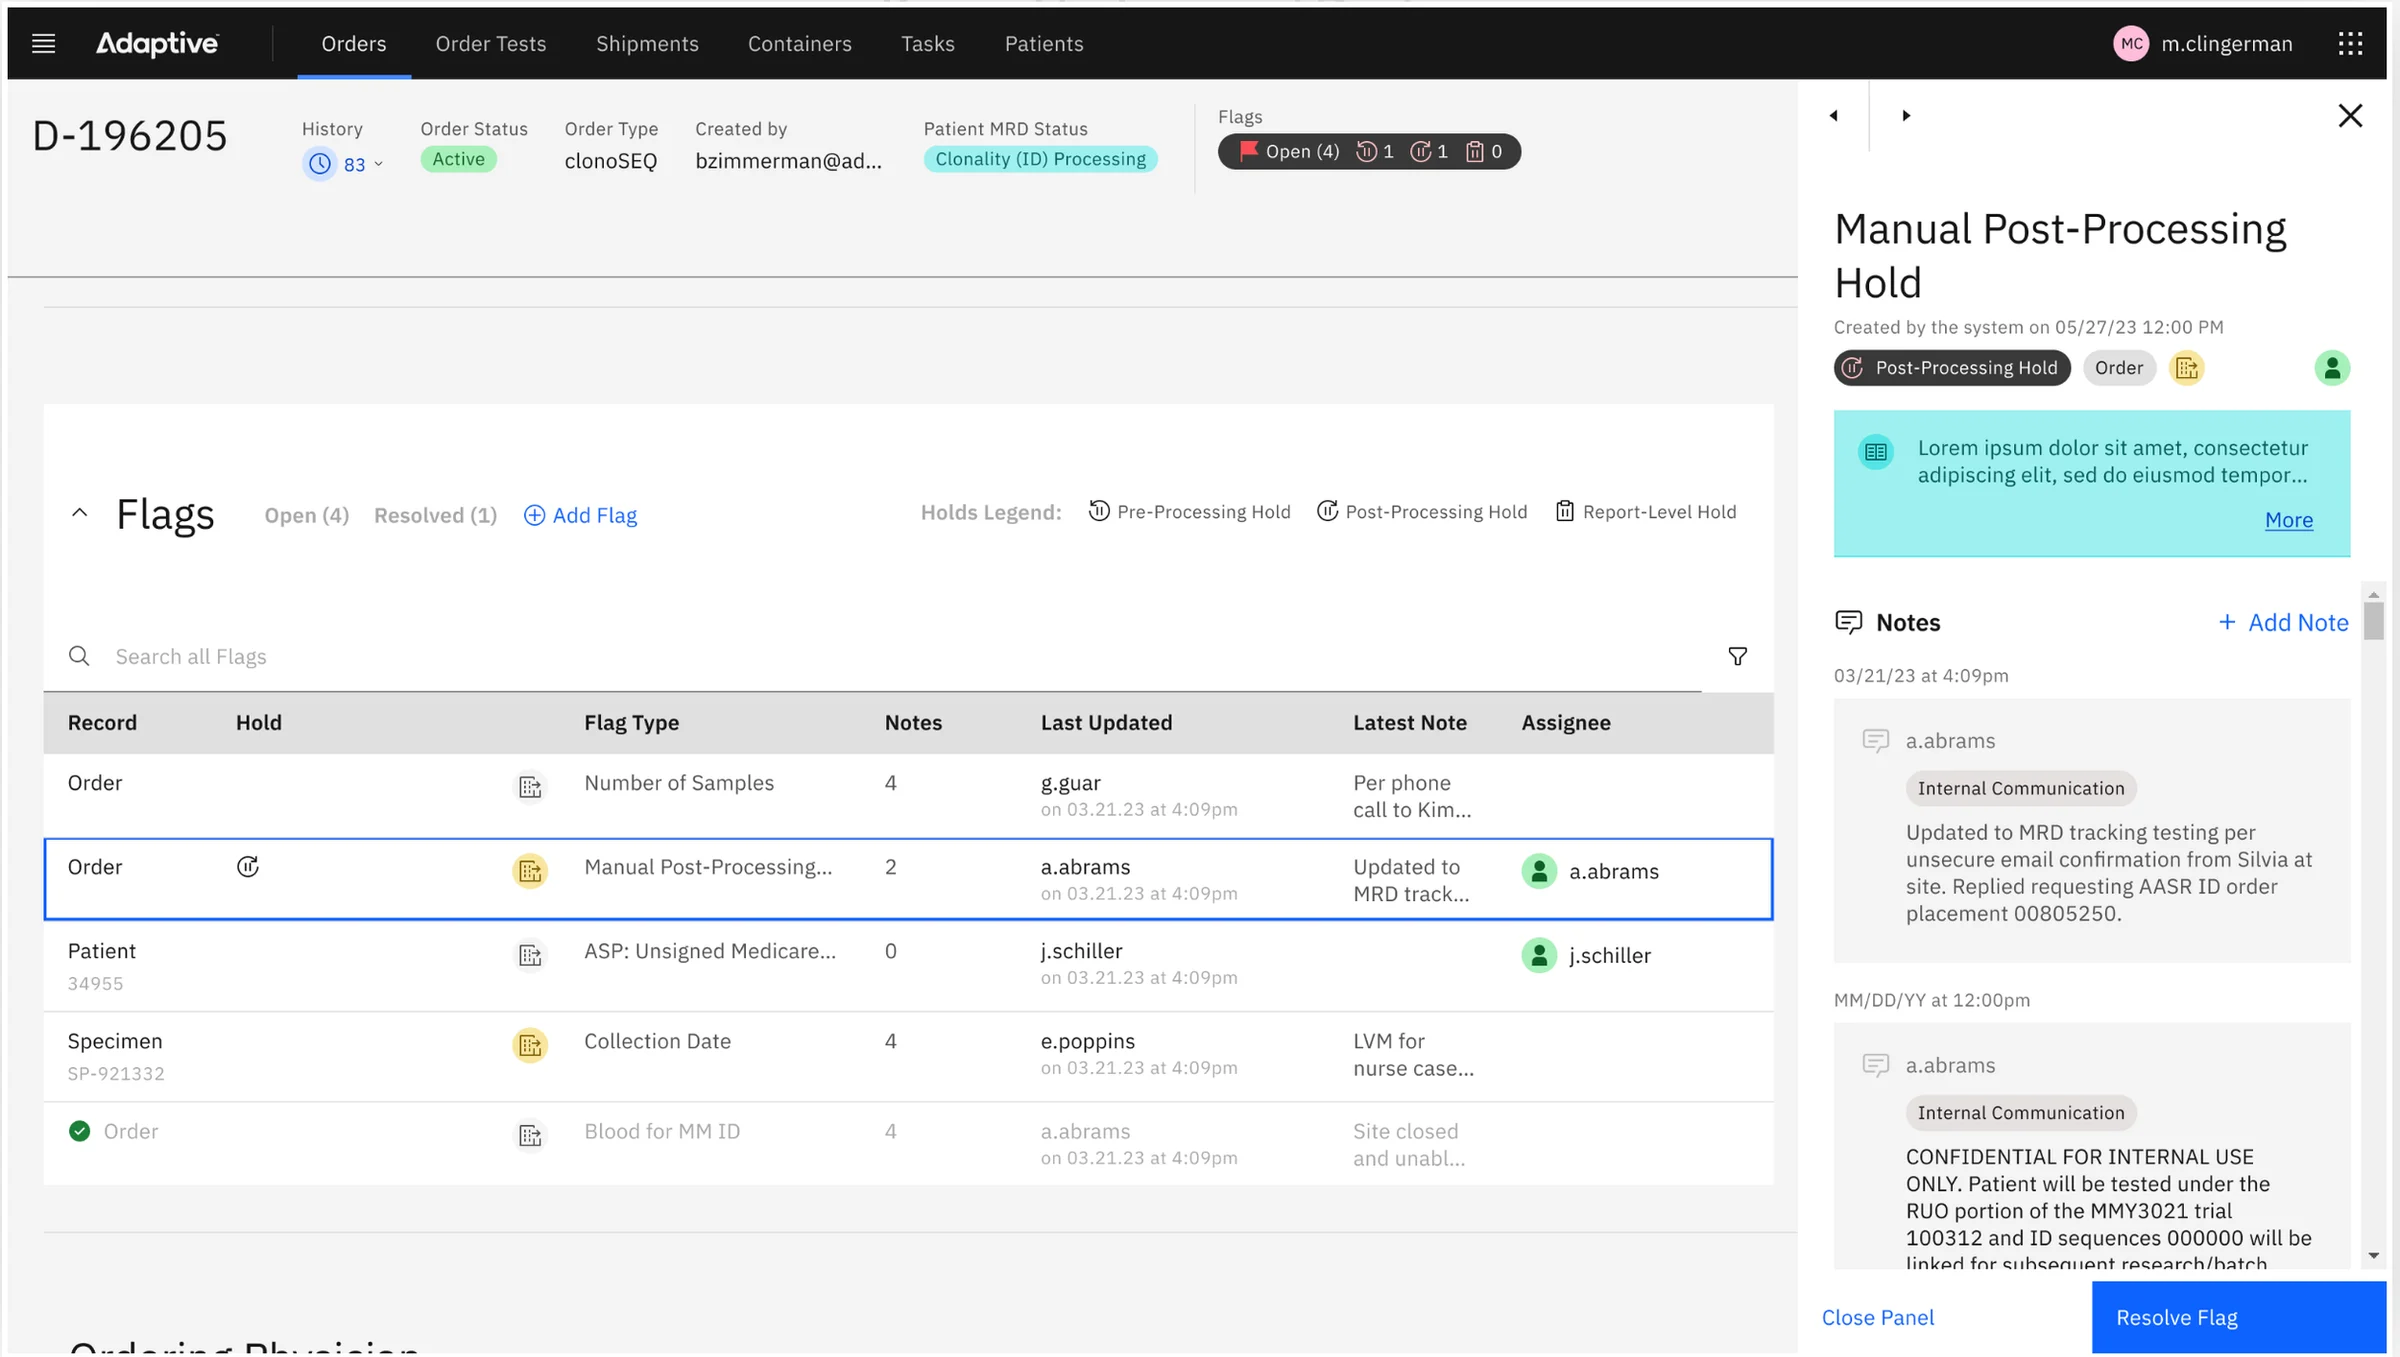
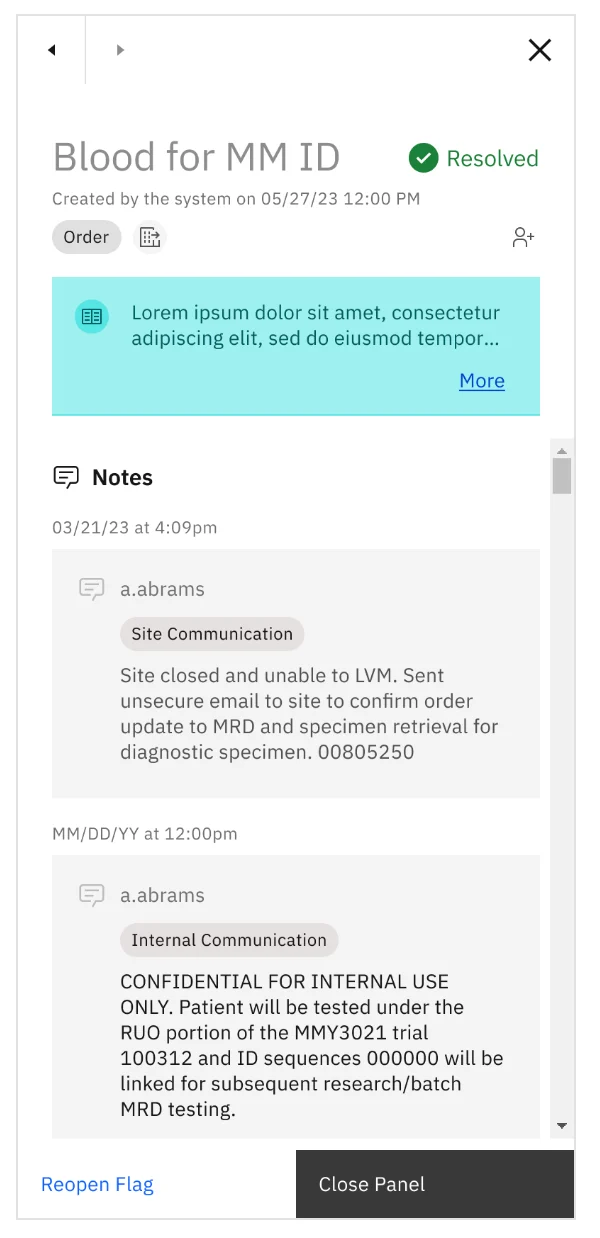
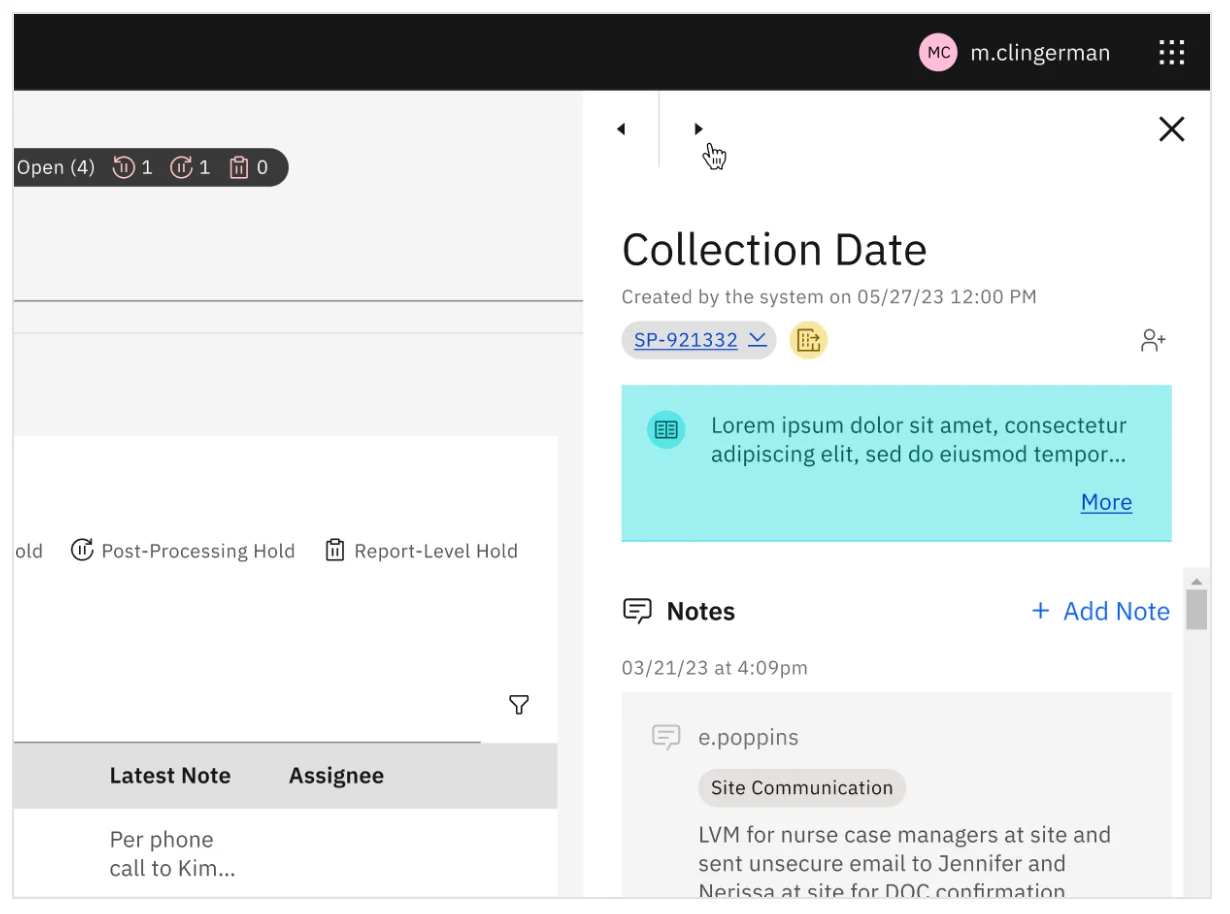
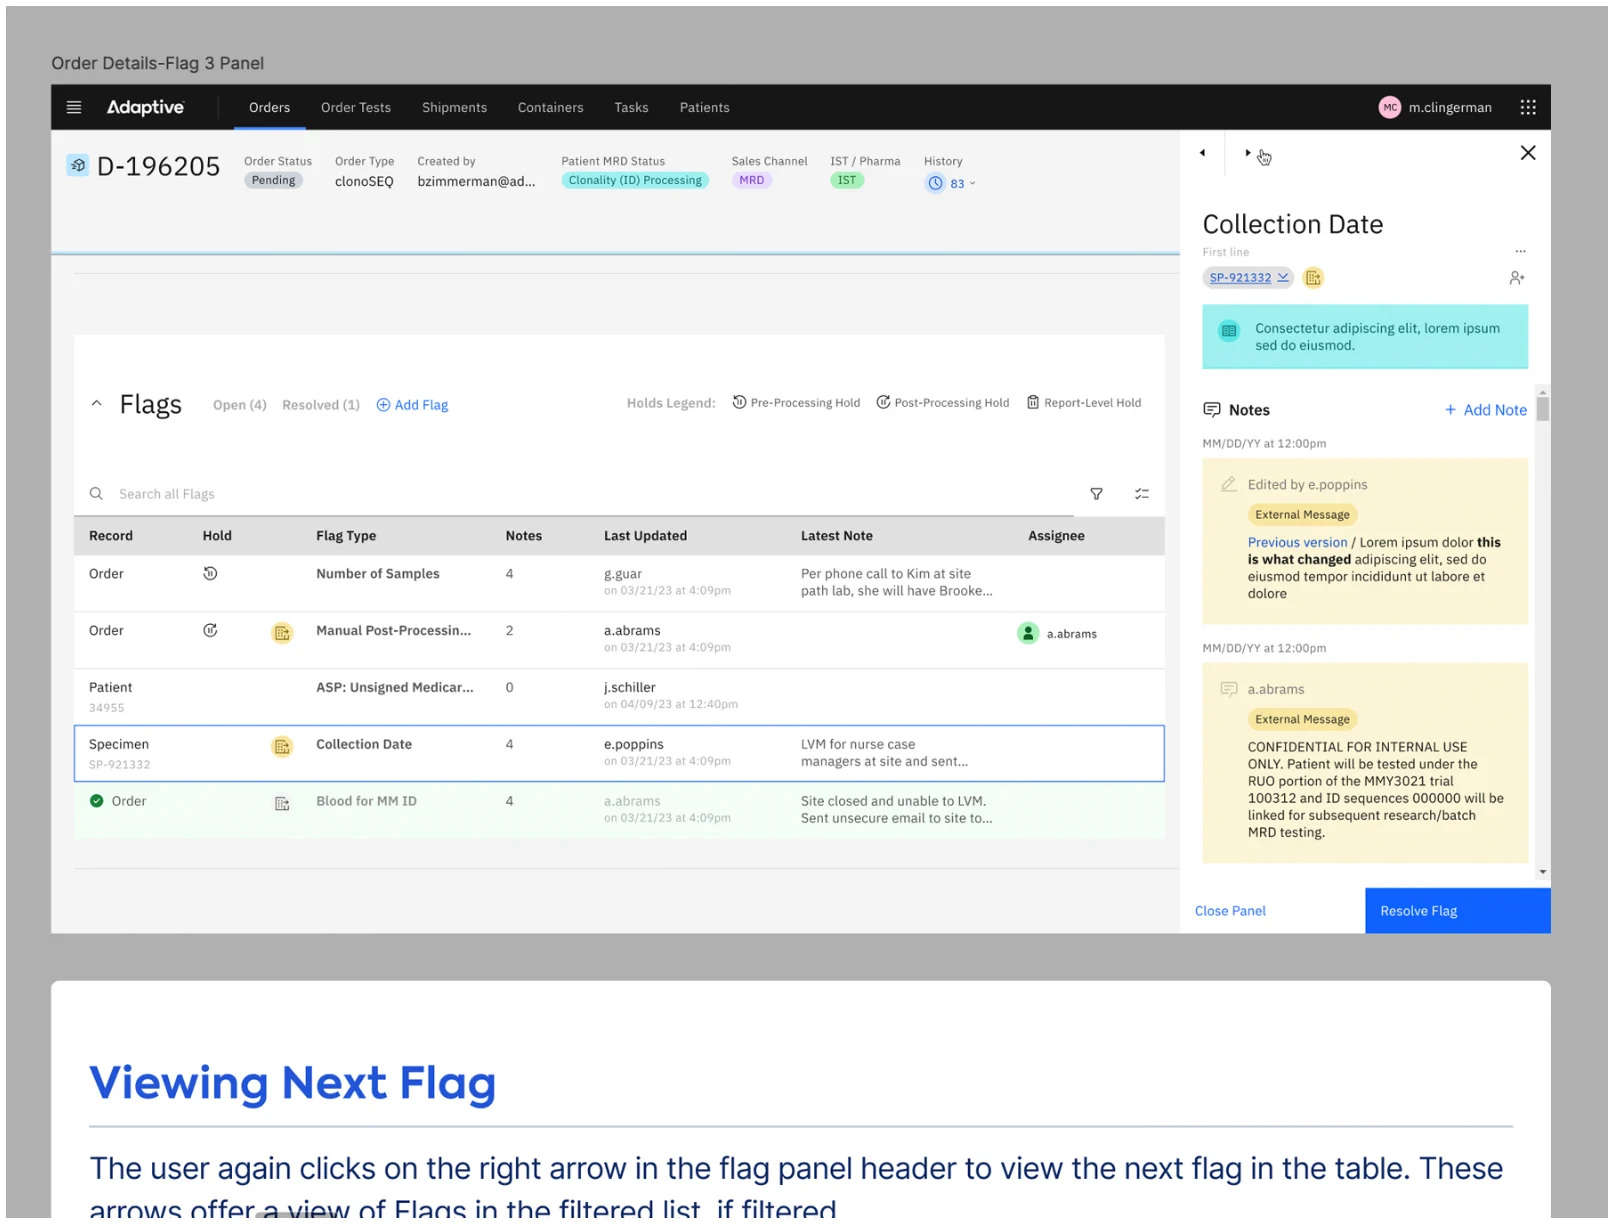
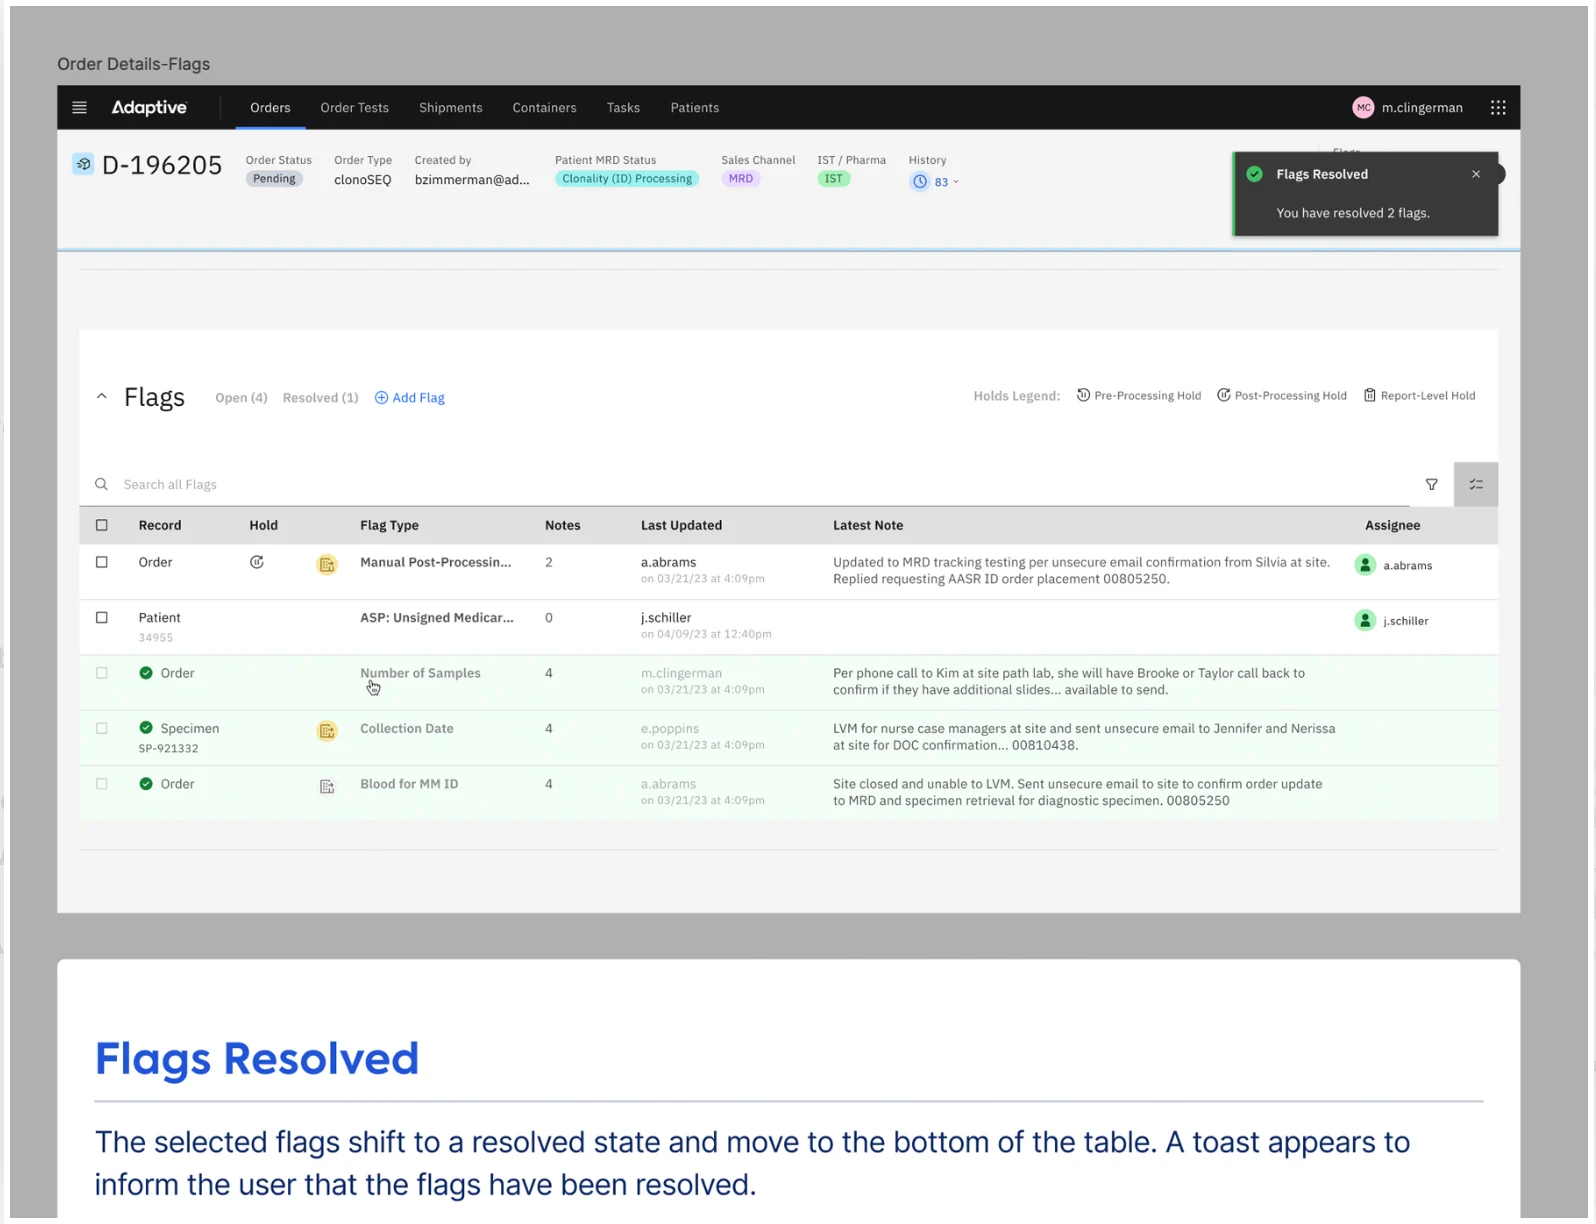
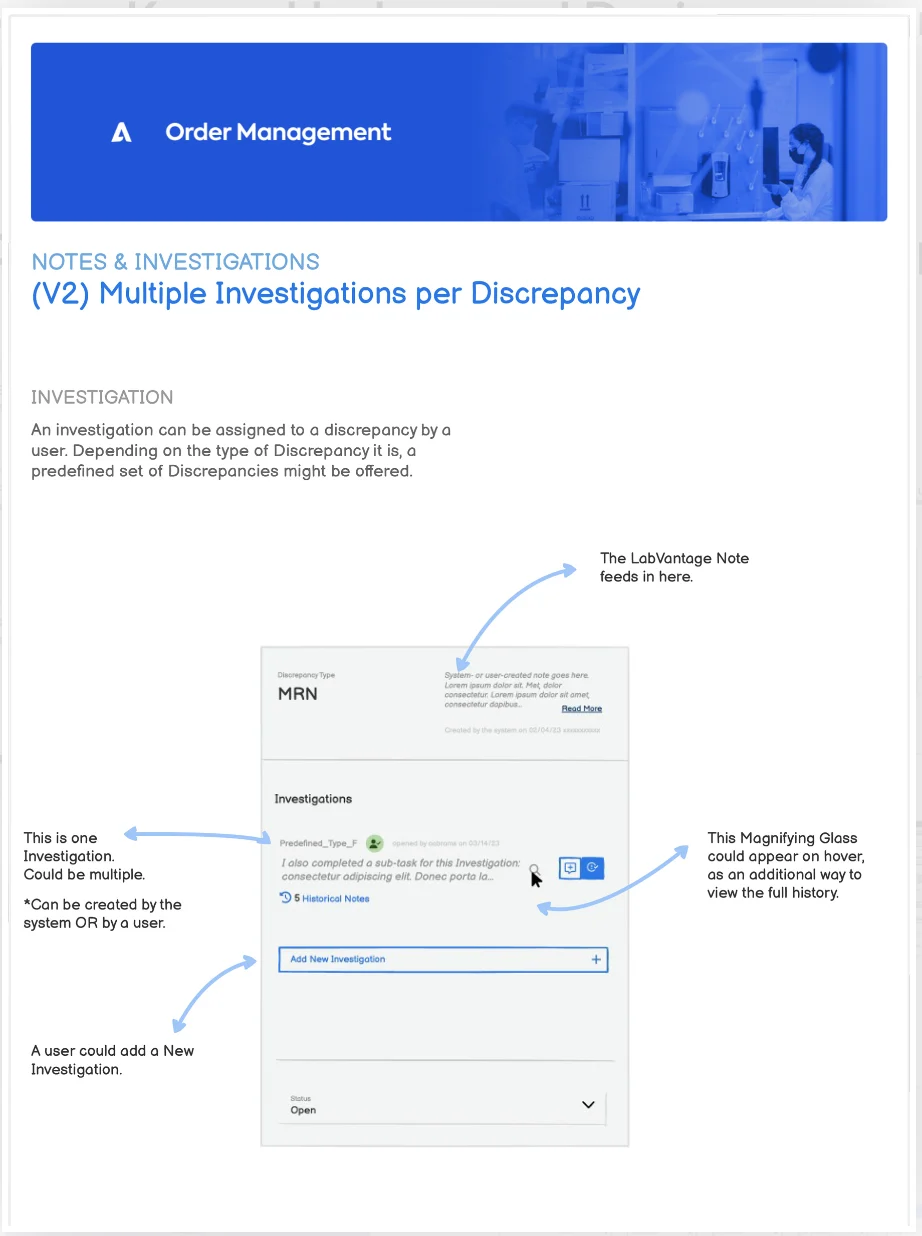
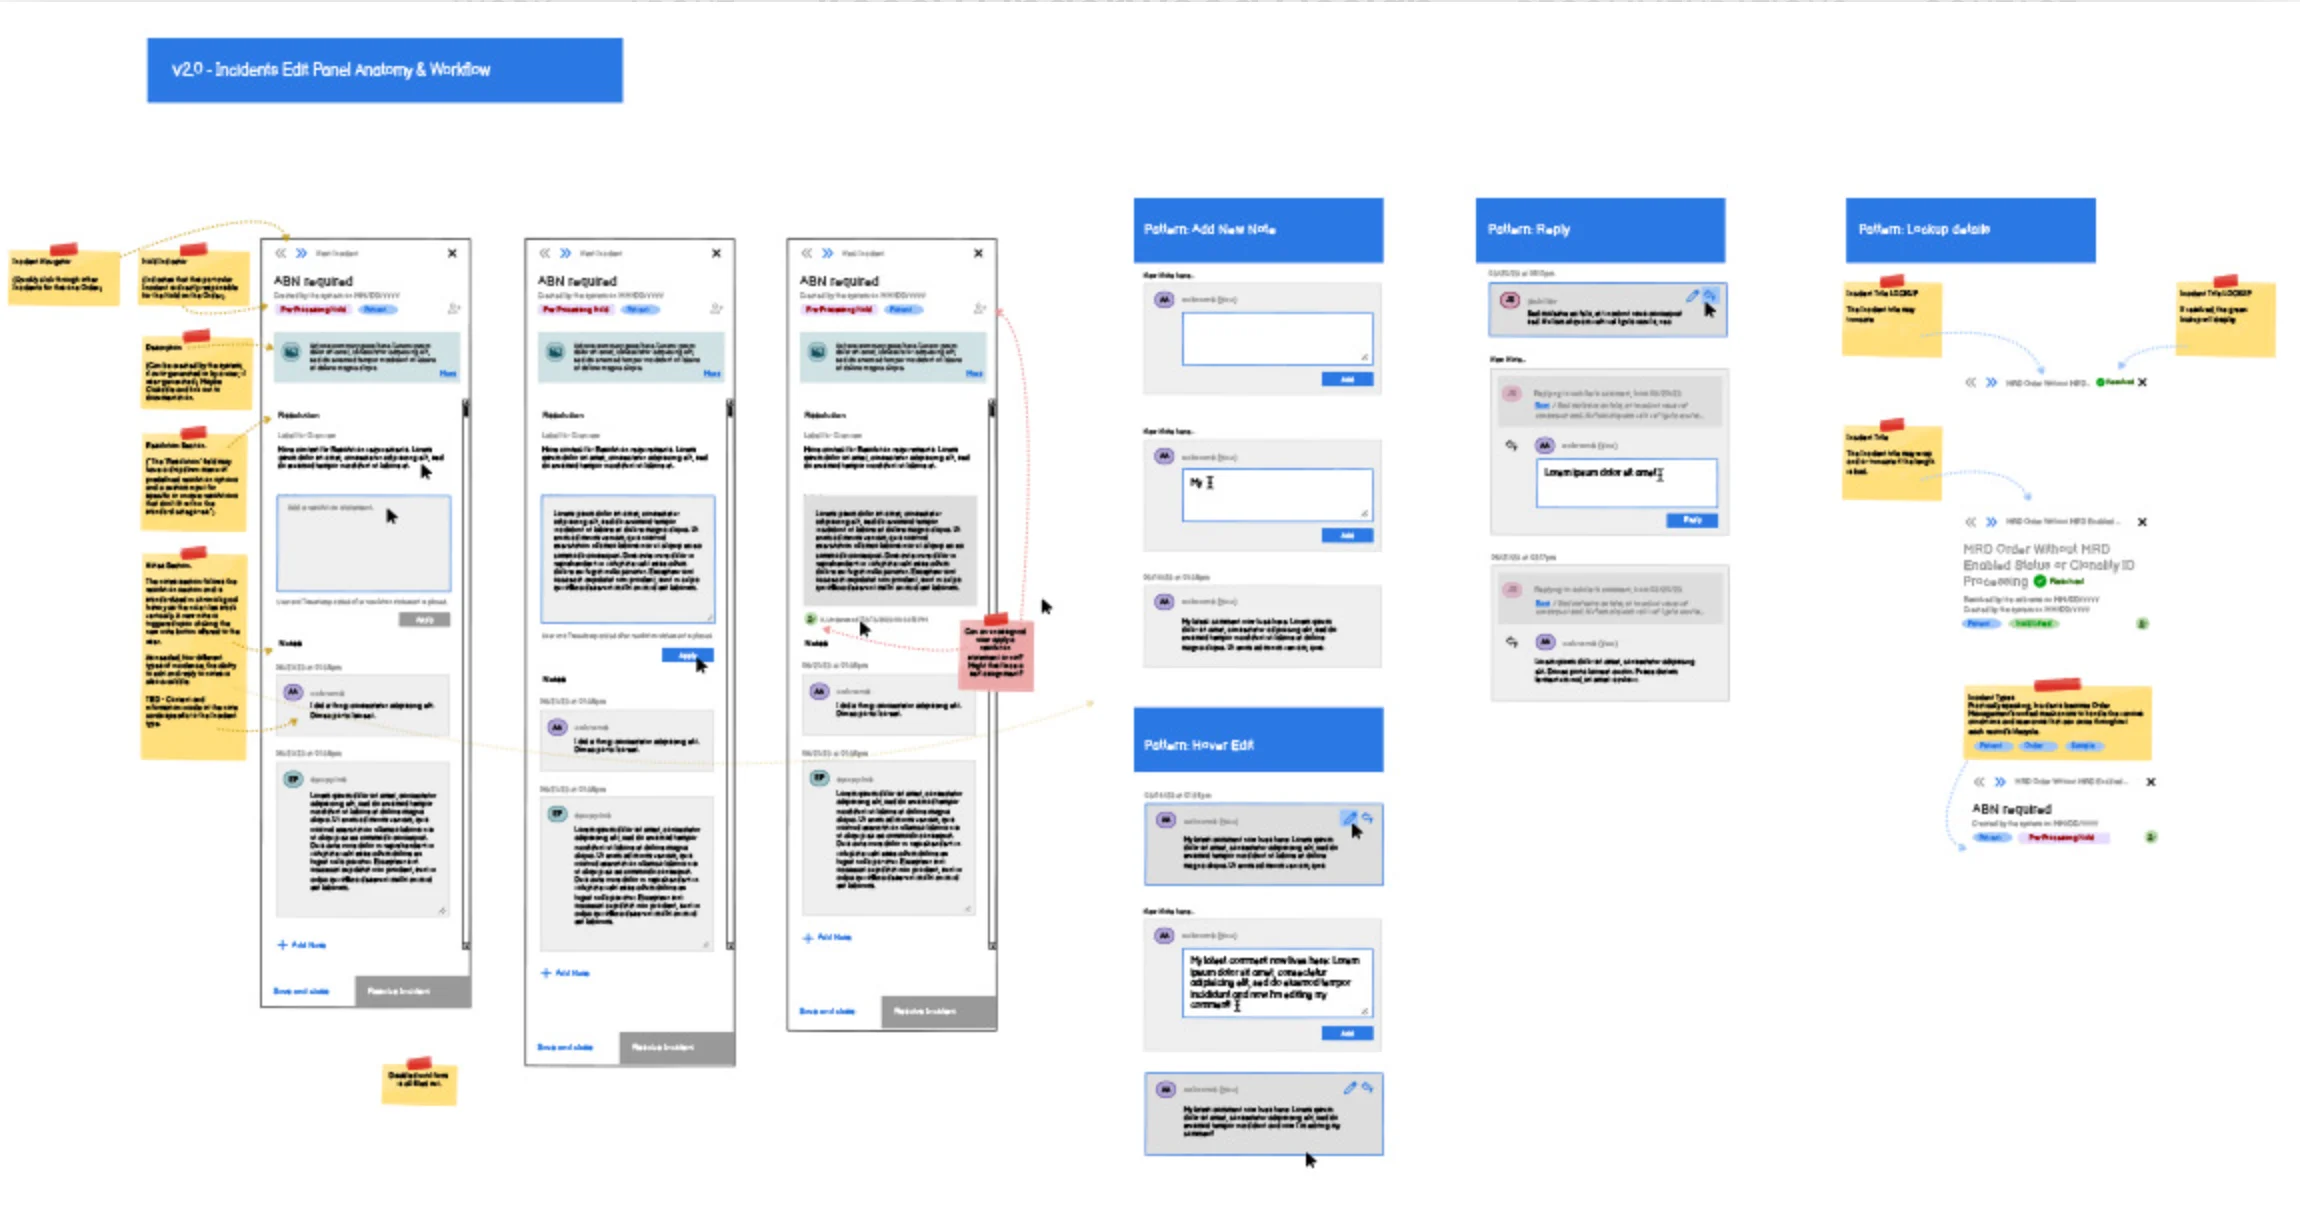
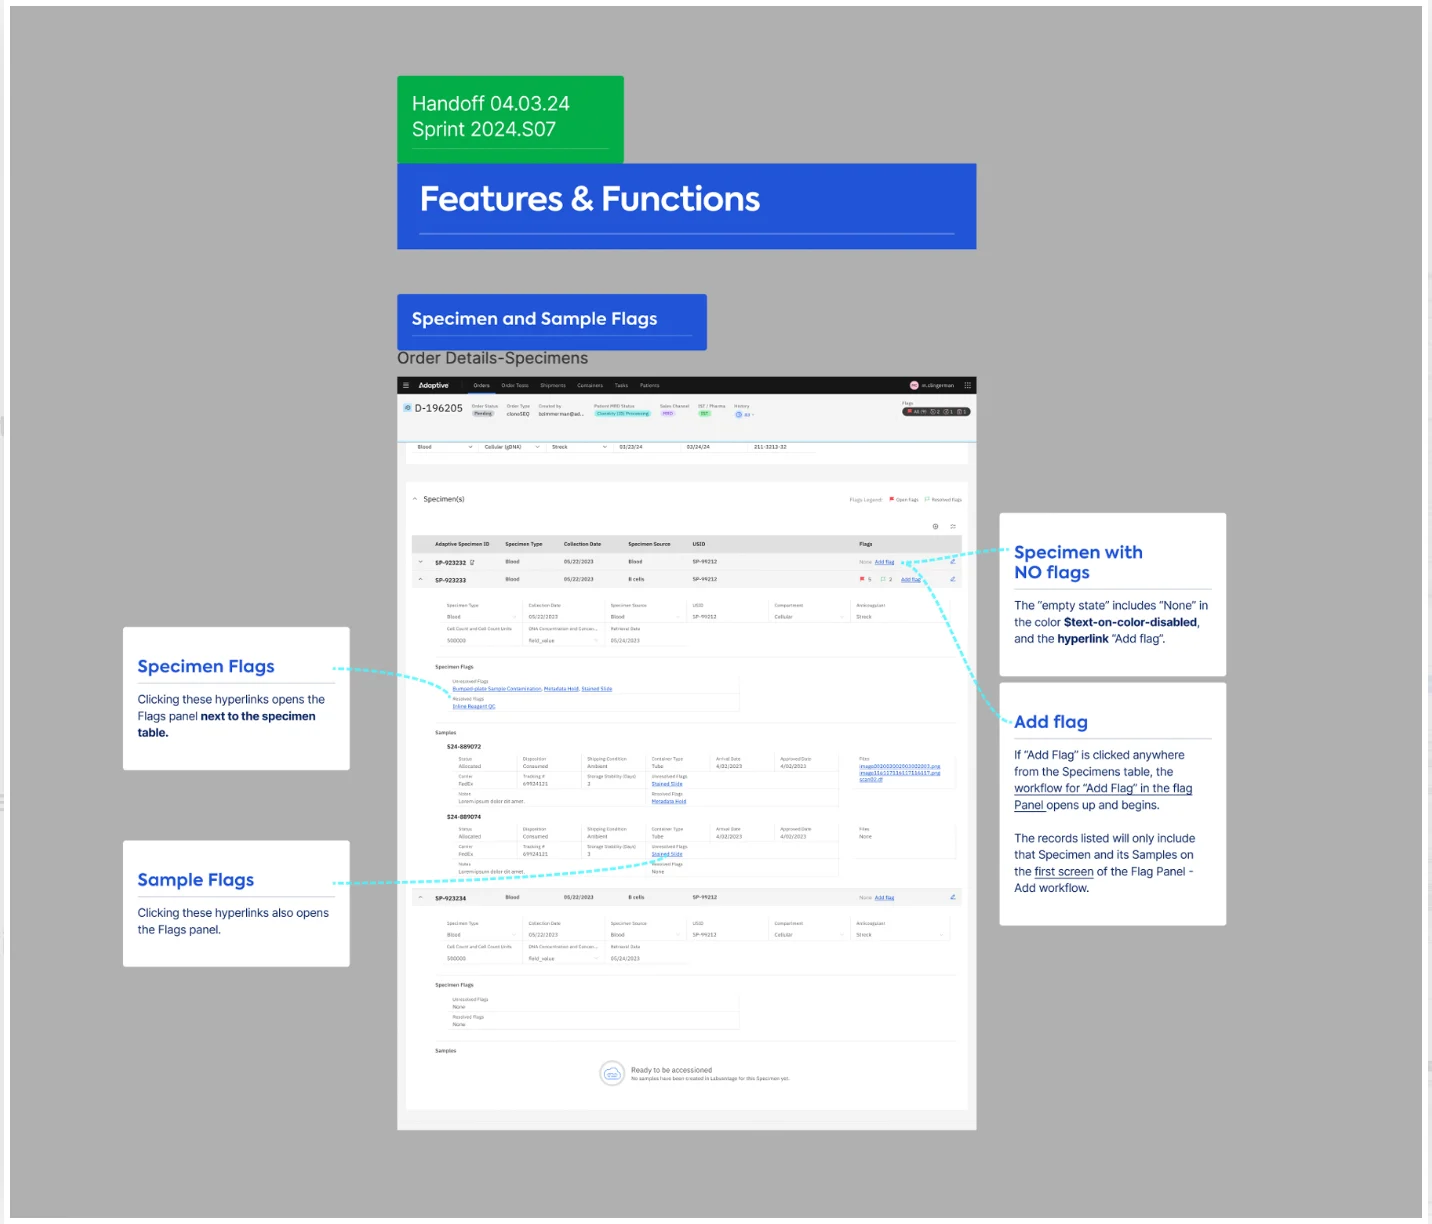
I helped the product owner author a new feature called Flags, a single indicator for any significant event that holds up an order. The design reduced cognitive load in two ways:
- A right-hand Flag Panel. Flags open in a panel beside the page instead of stacking in the page body, so the user doesn't scroll through flag after flag.
- A cognitive bookmark. With the flag open on the right, the user can scan the rest of the page for the one piece of data that resolves it.
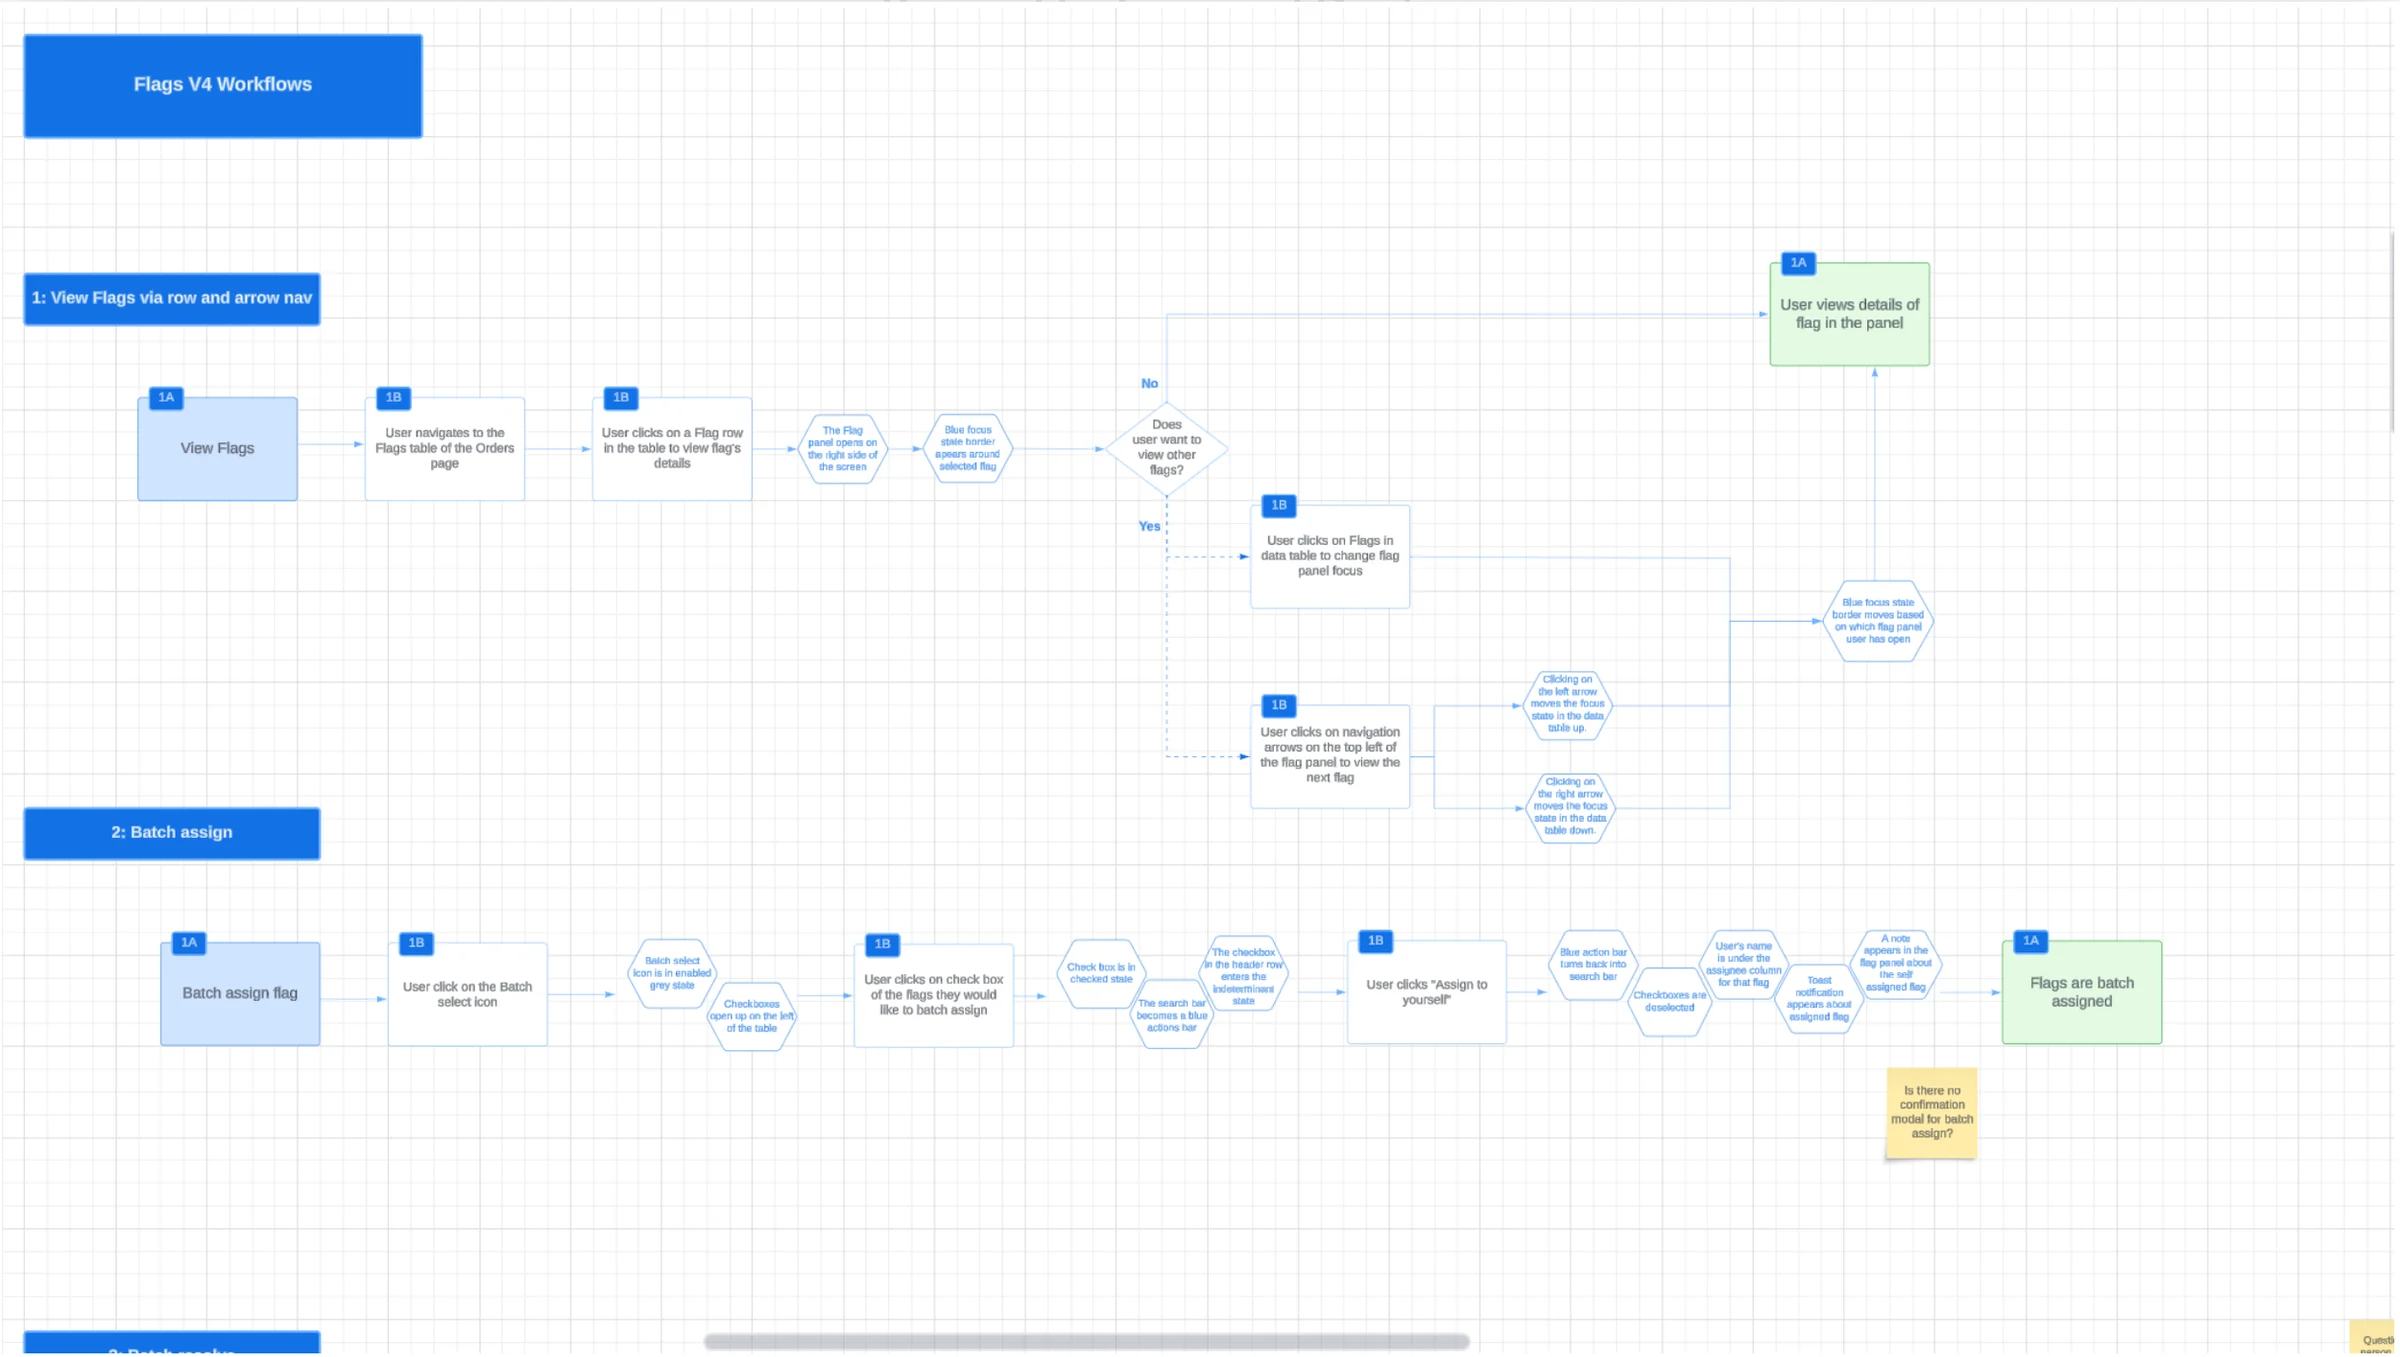
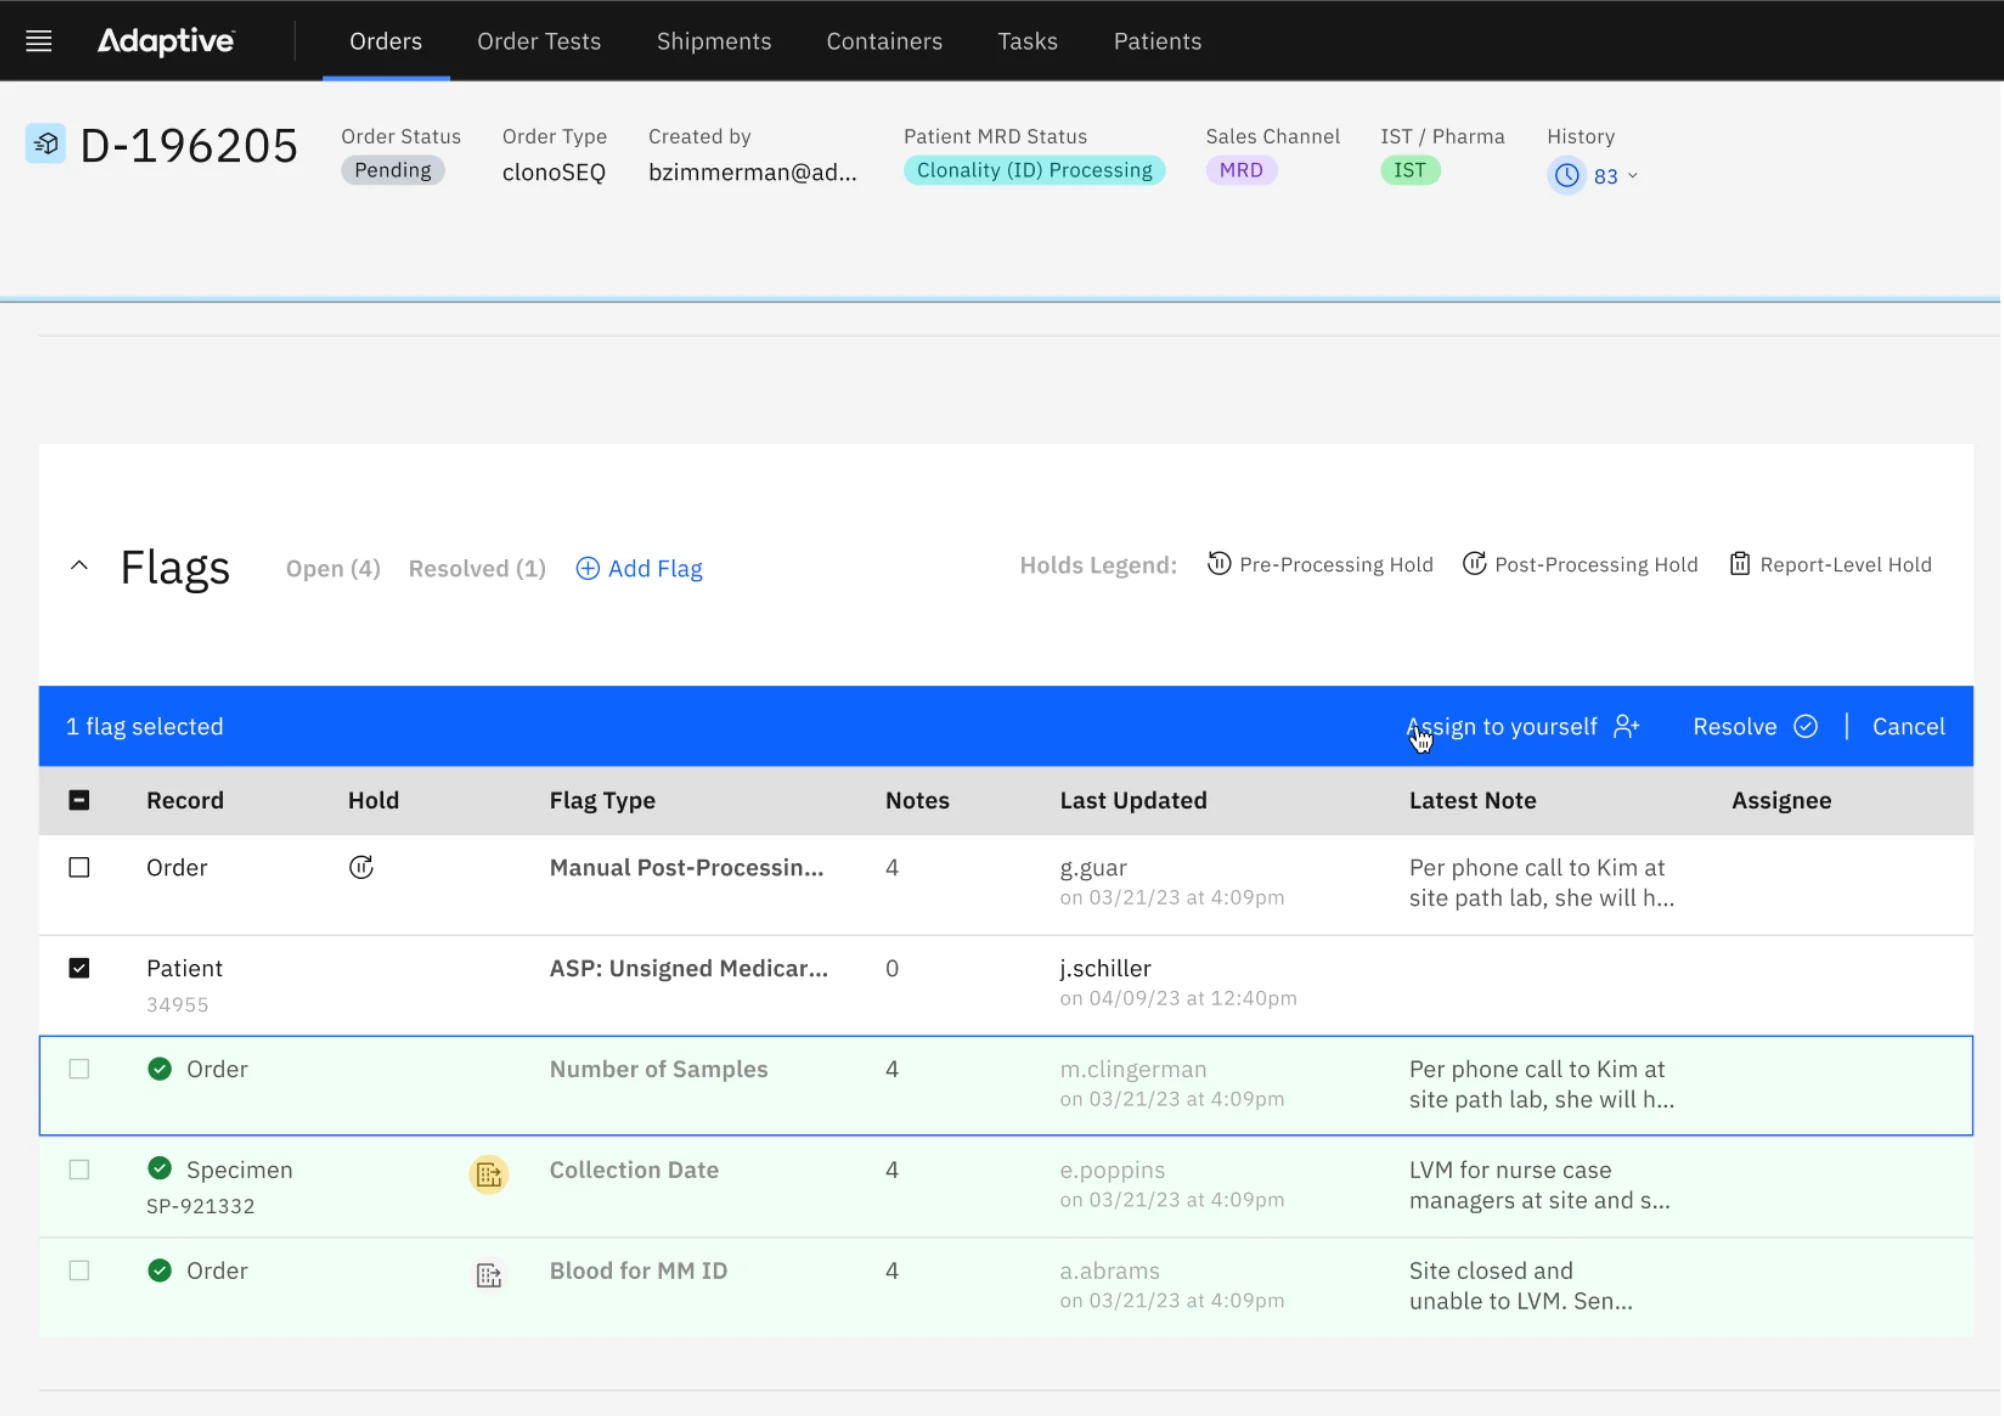
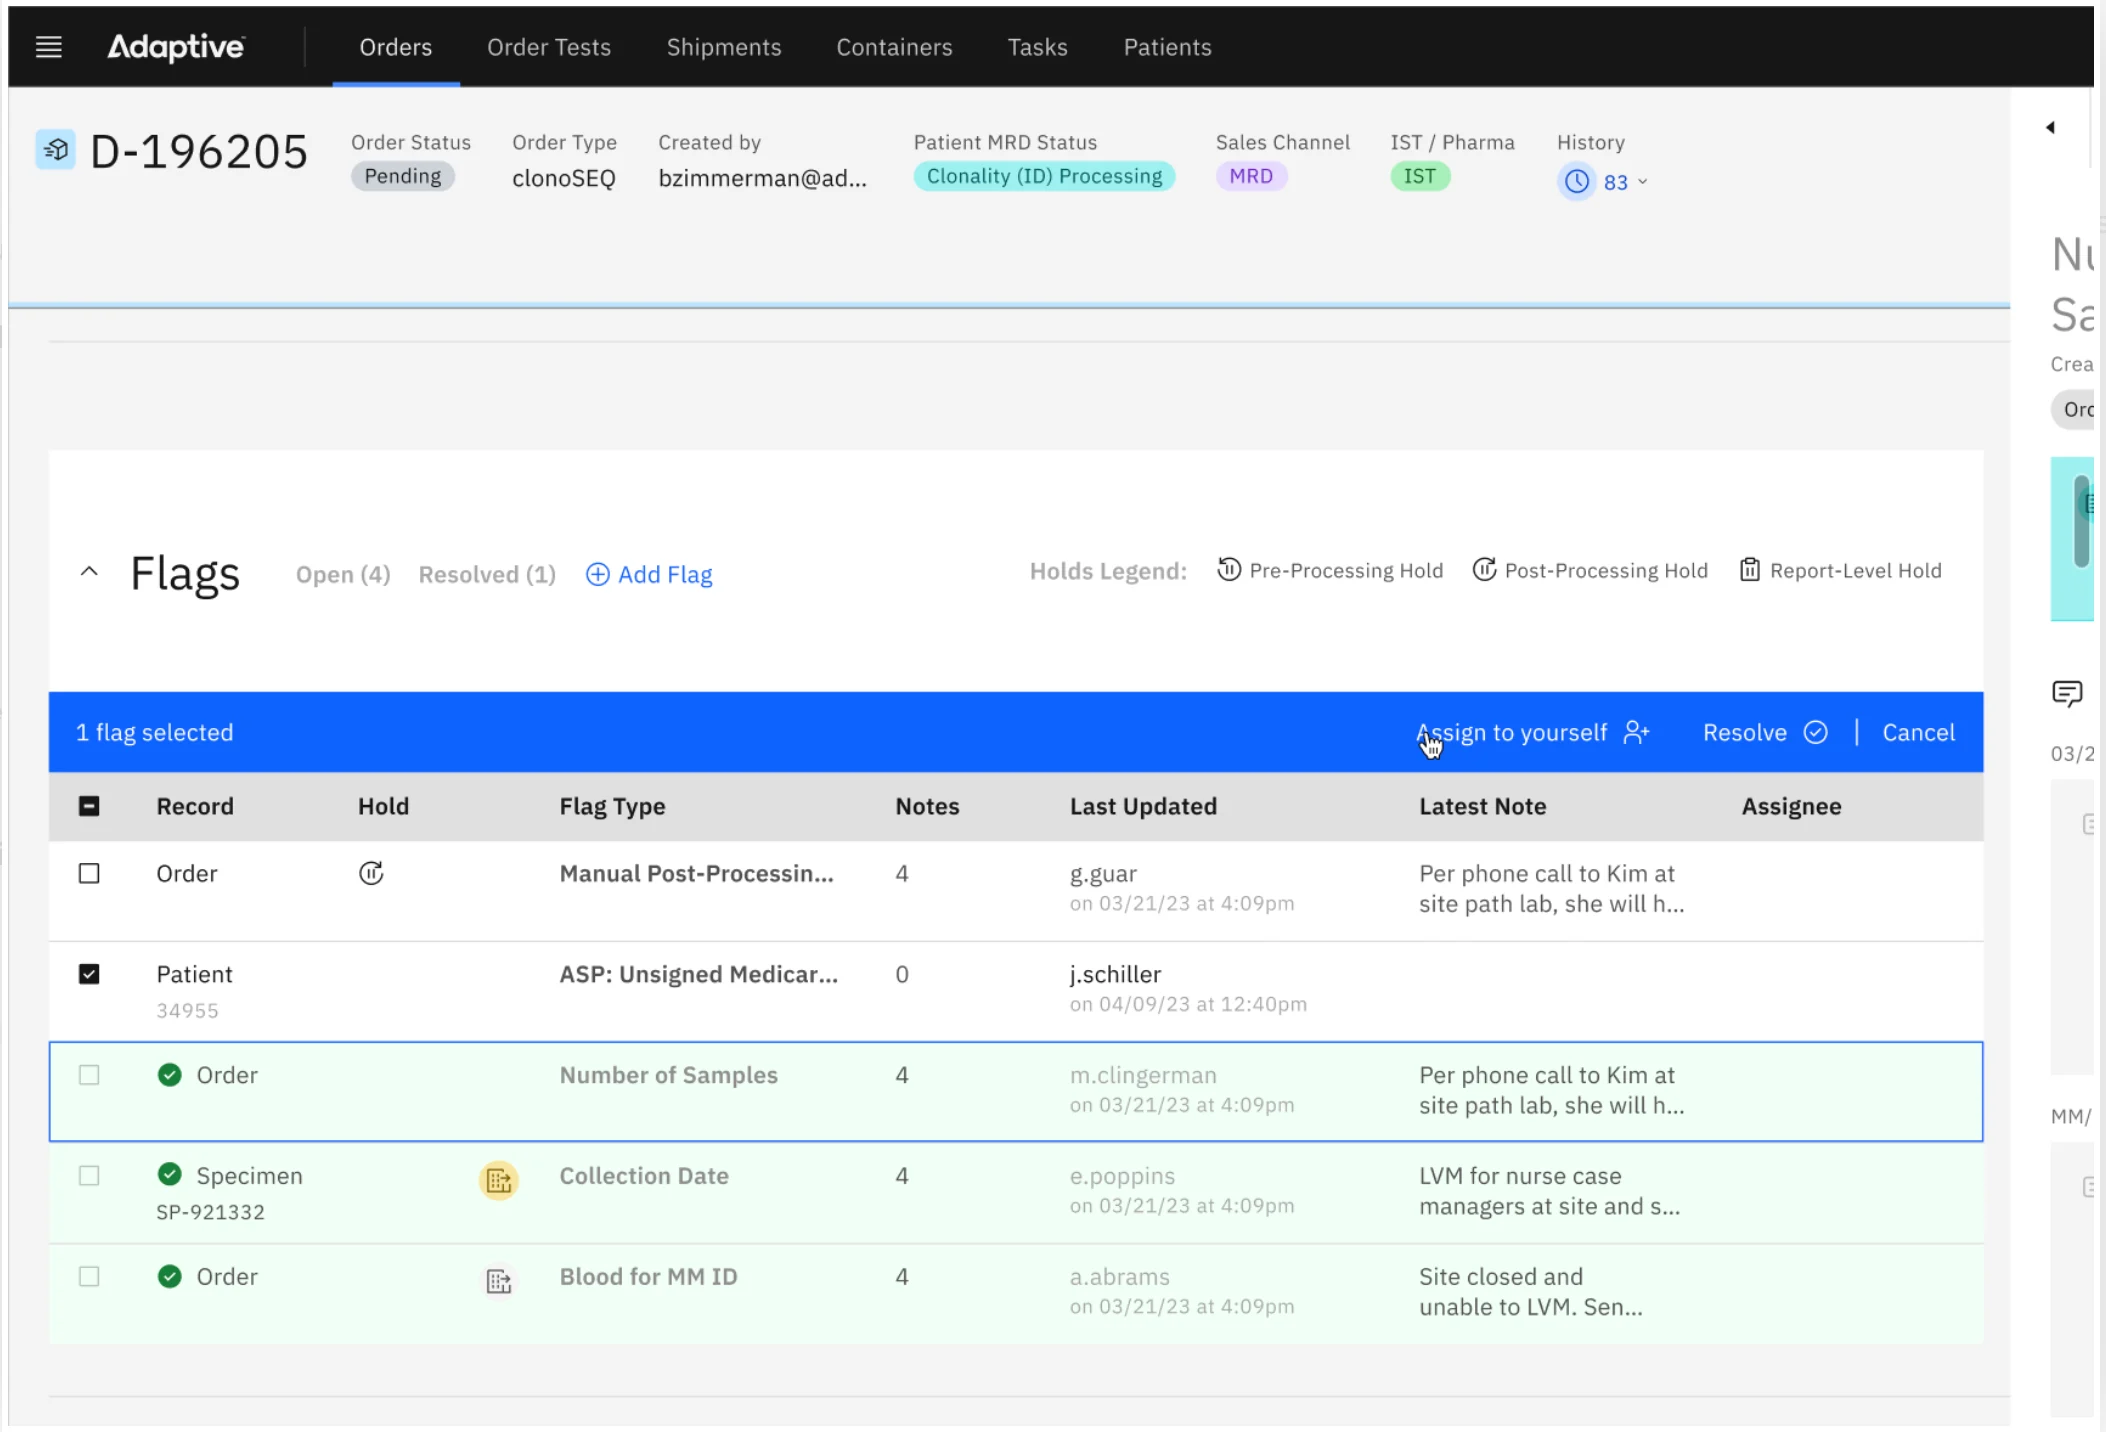
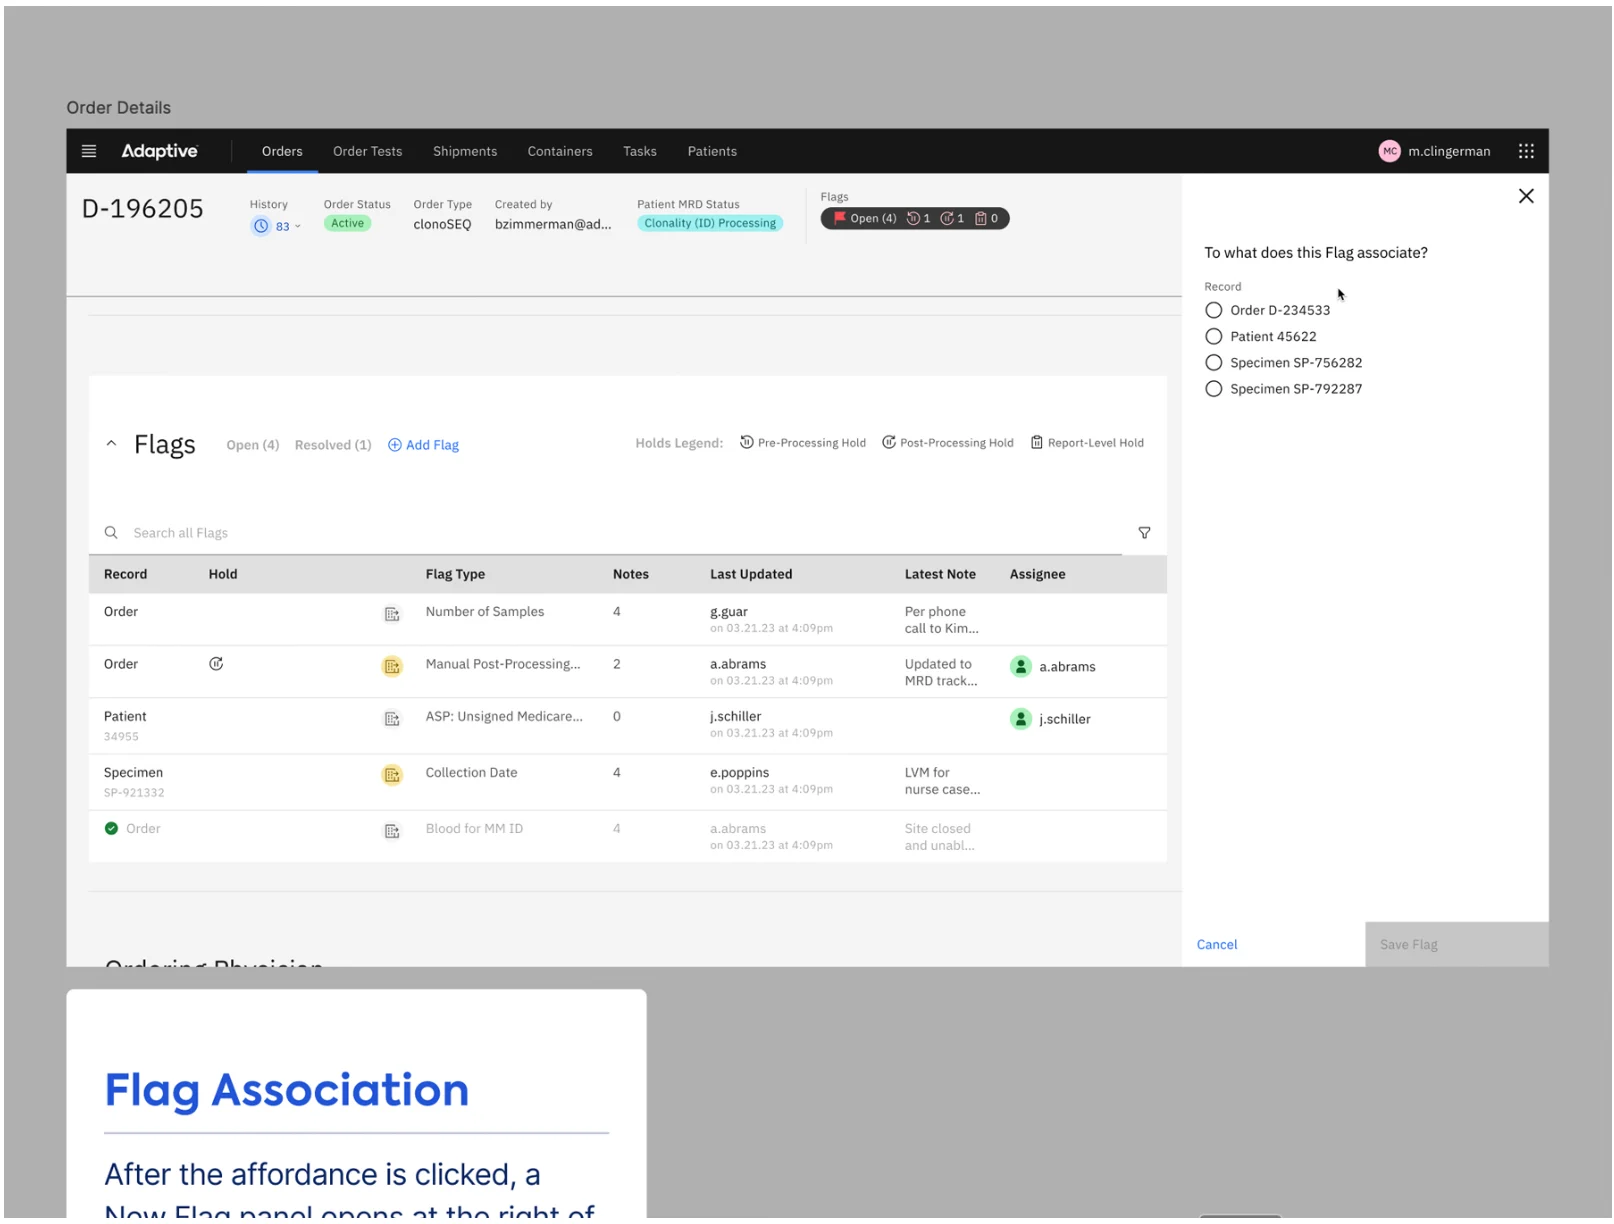
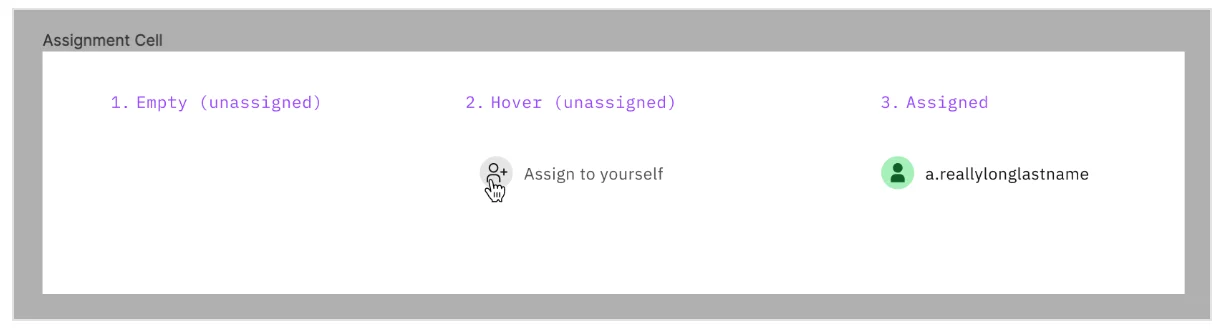
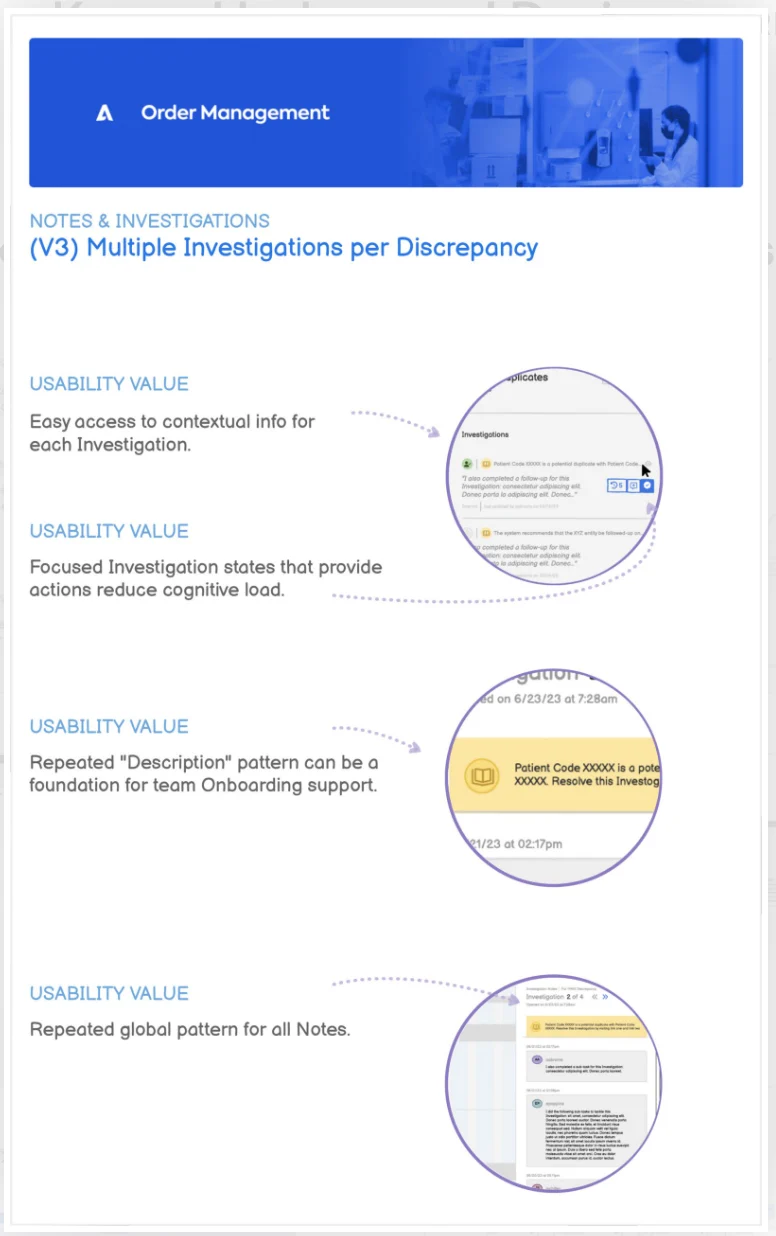
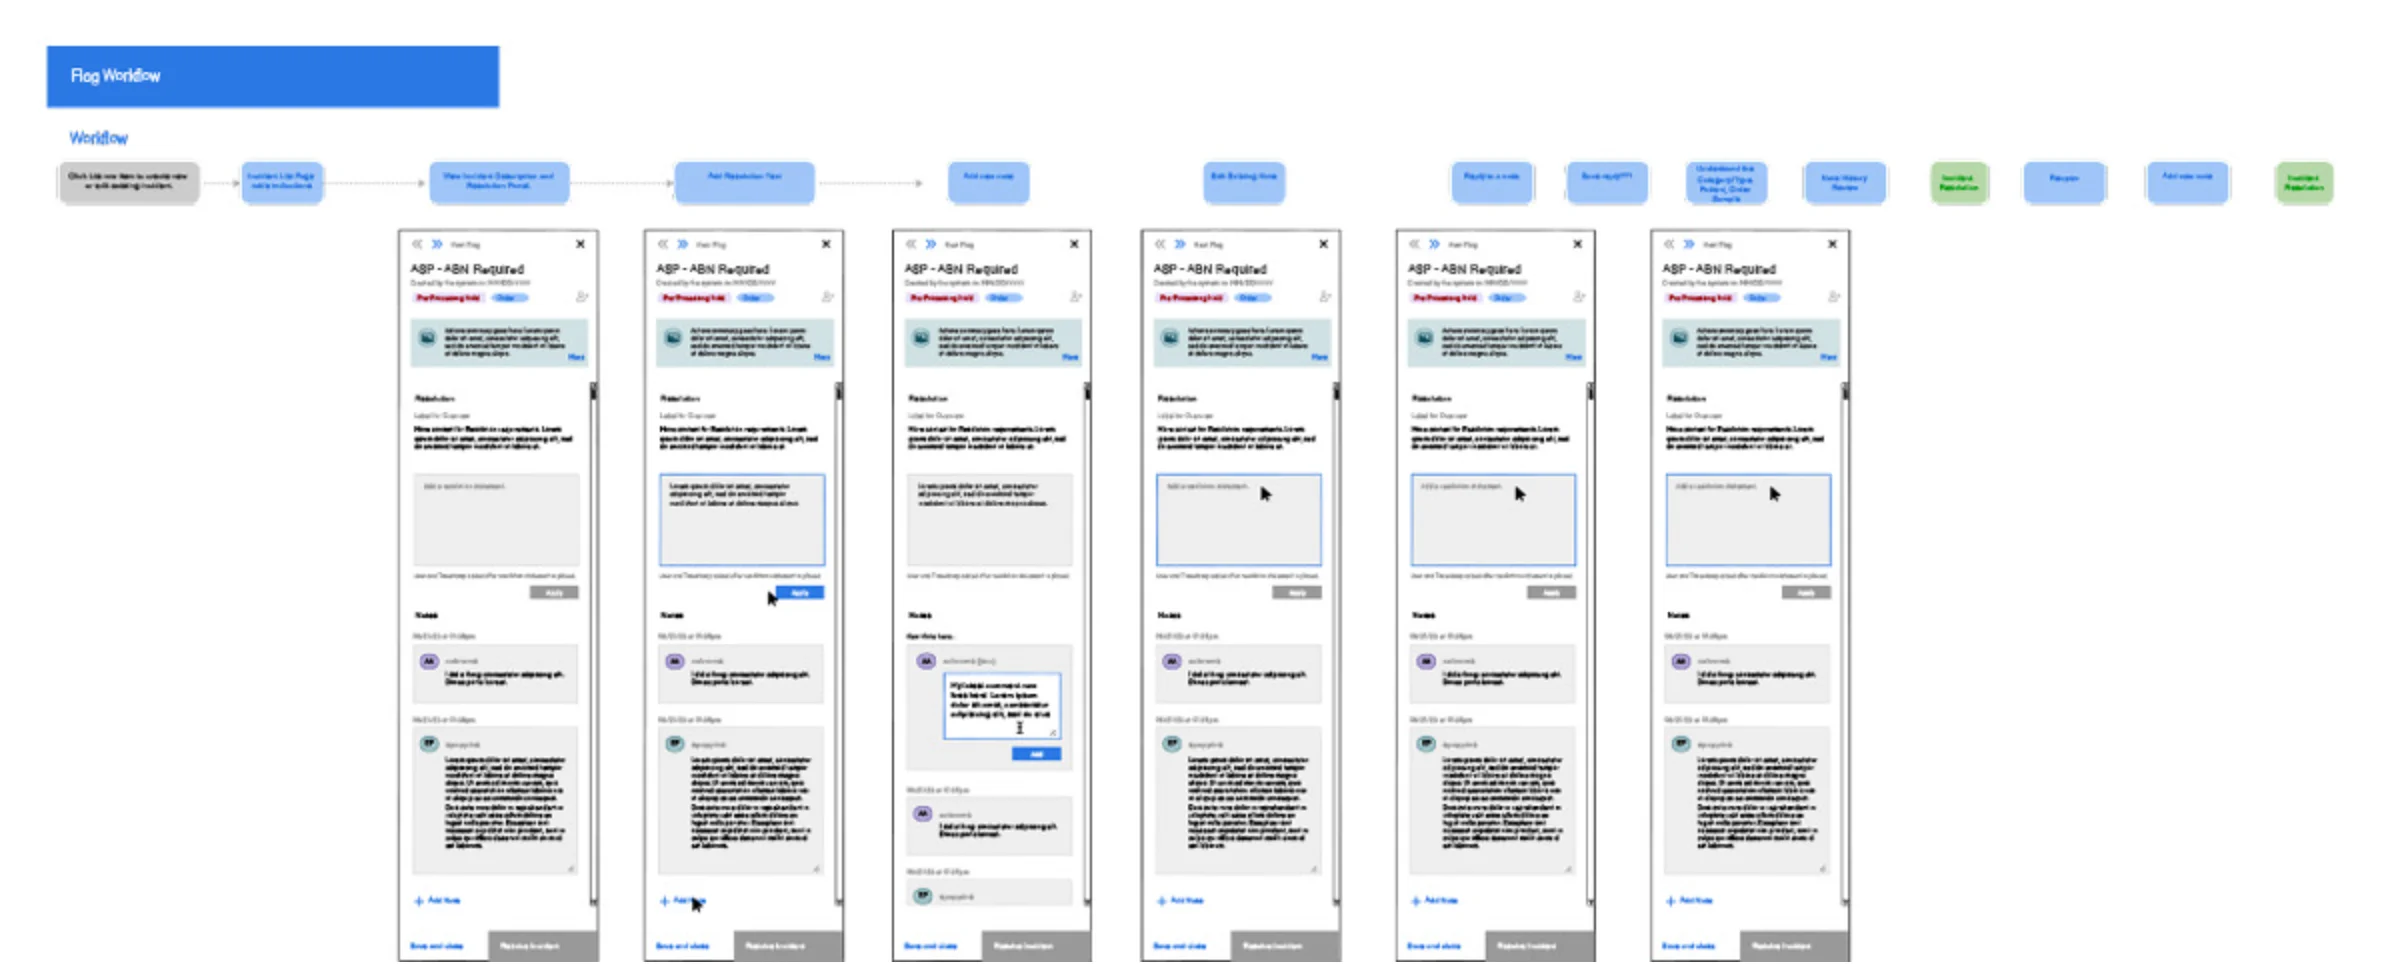
The team defined the Flags workflows in Lucidchart, then designed the list, the panel, batch selection and actions, assignment, notes and investigations, moving to the next flag, associating a flag with a record, and the resolved state, where resolved flags drop to the bottom of the table and a toast confirms it.
Data tables
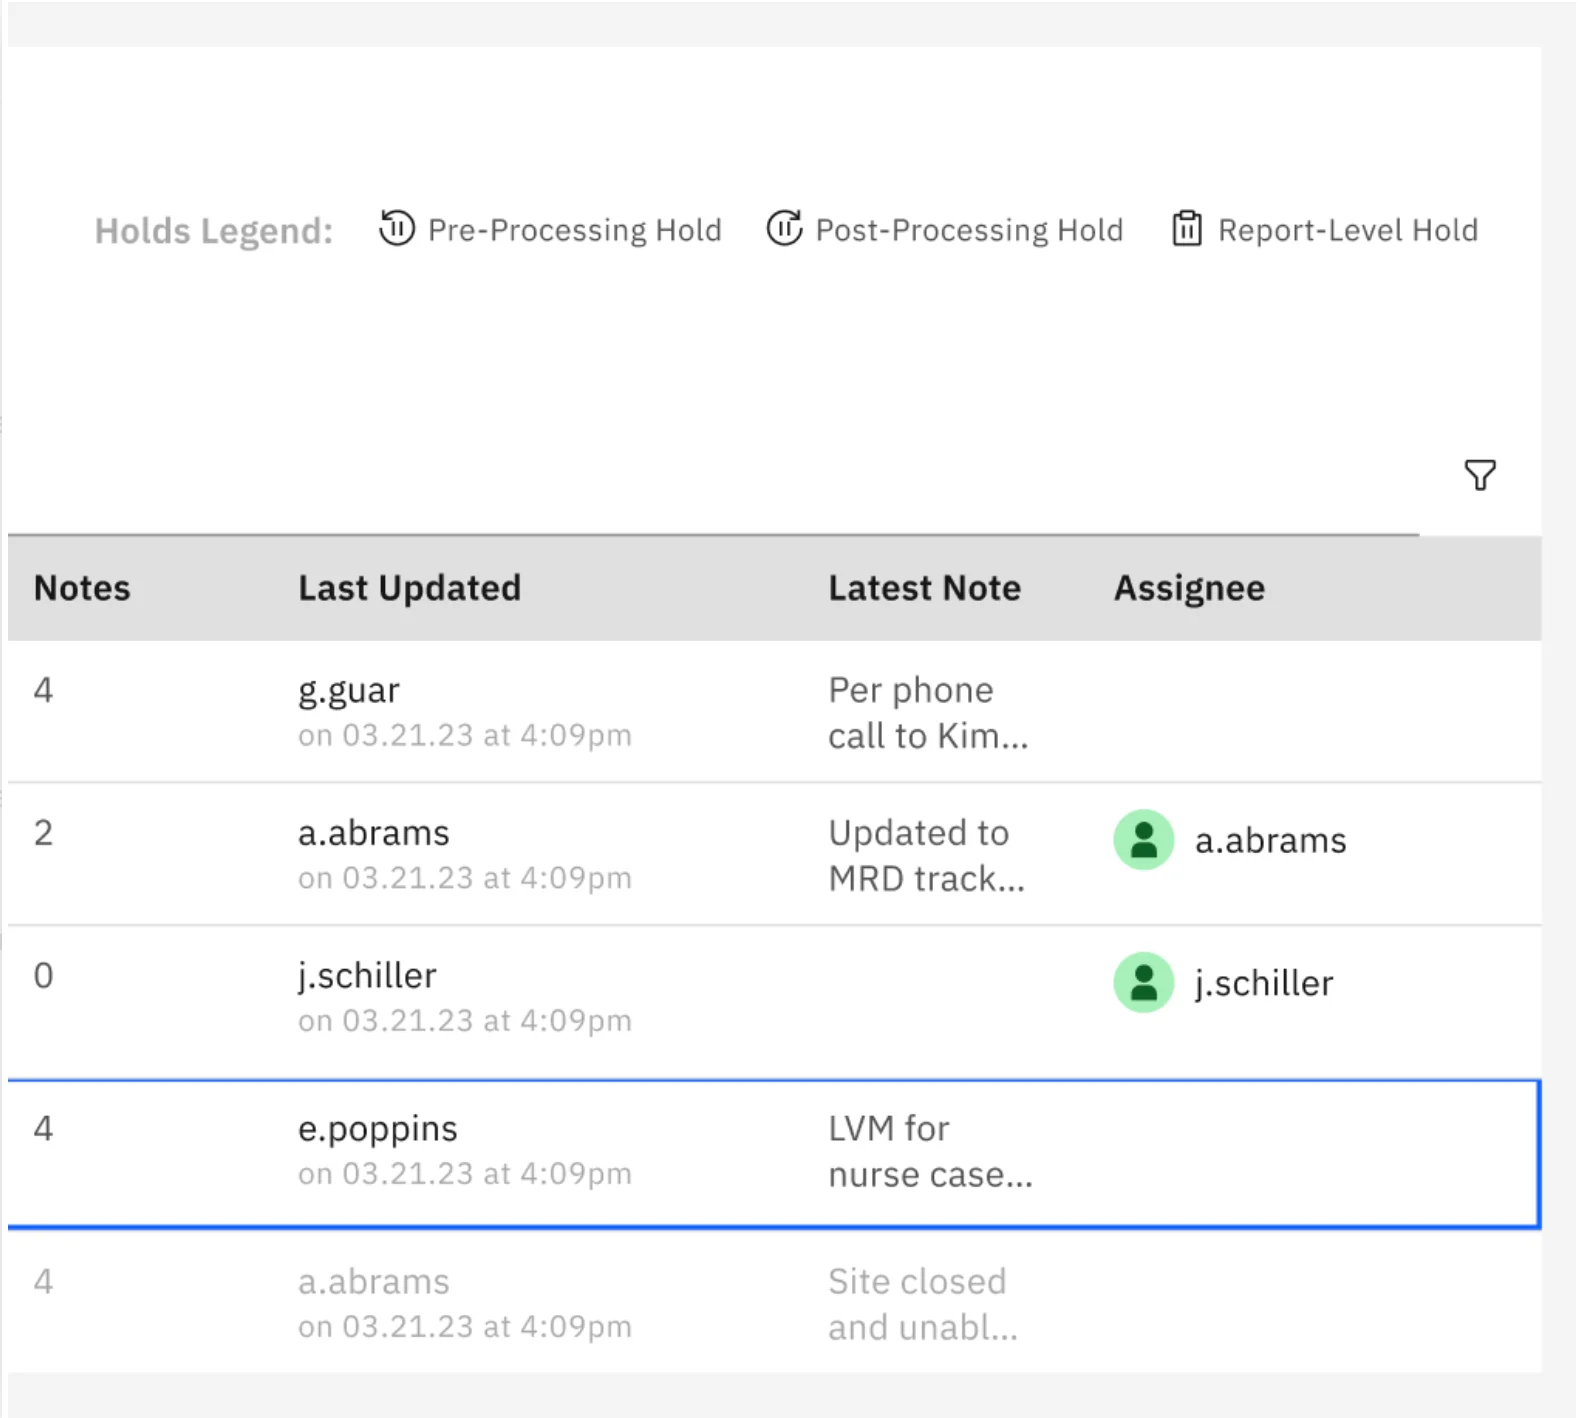
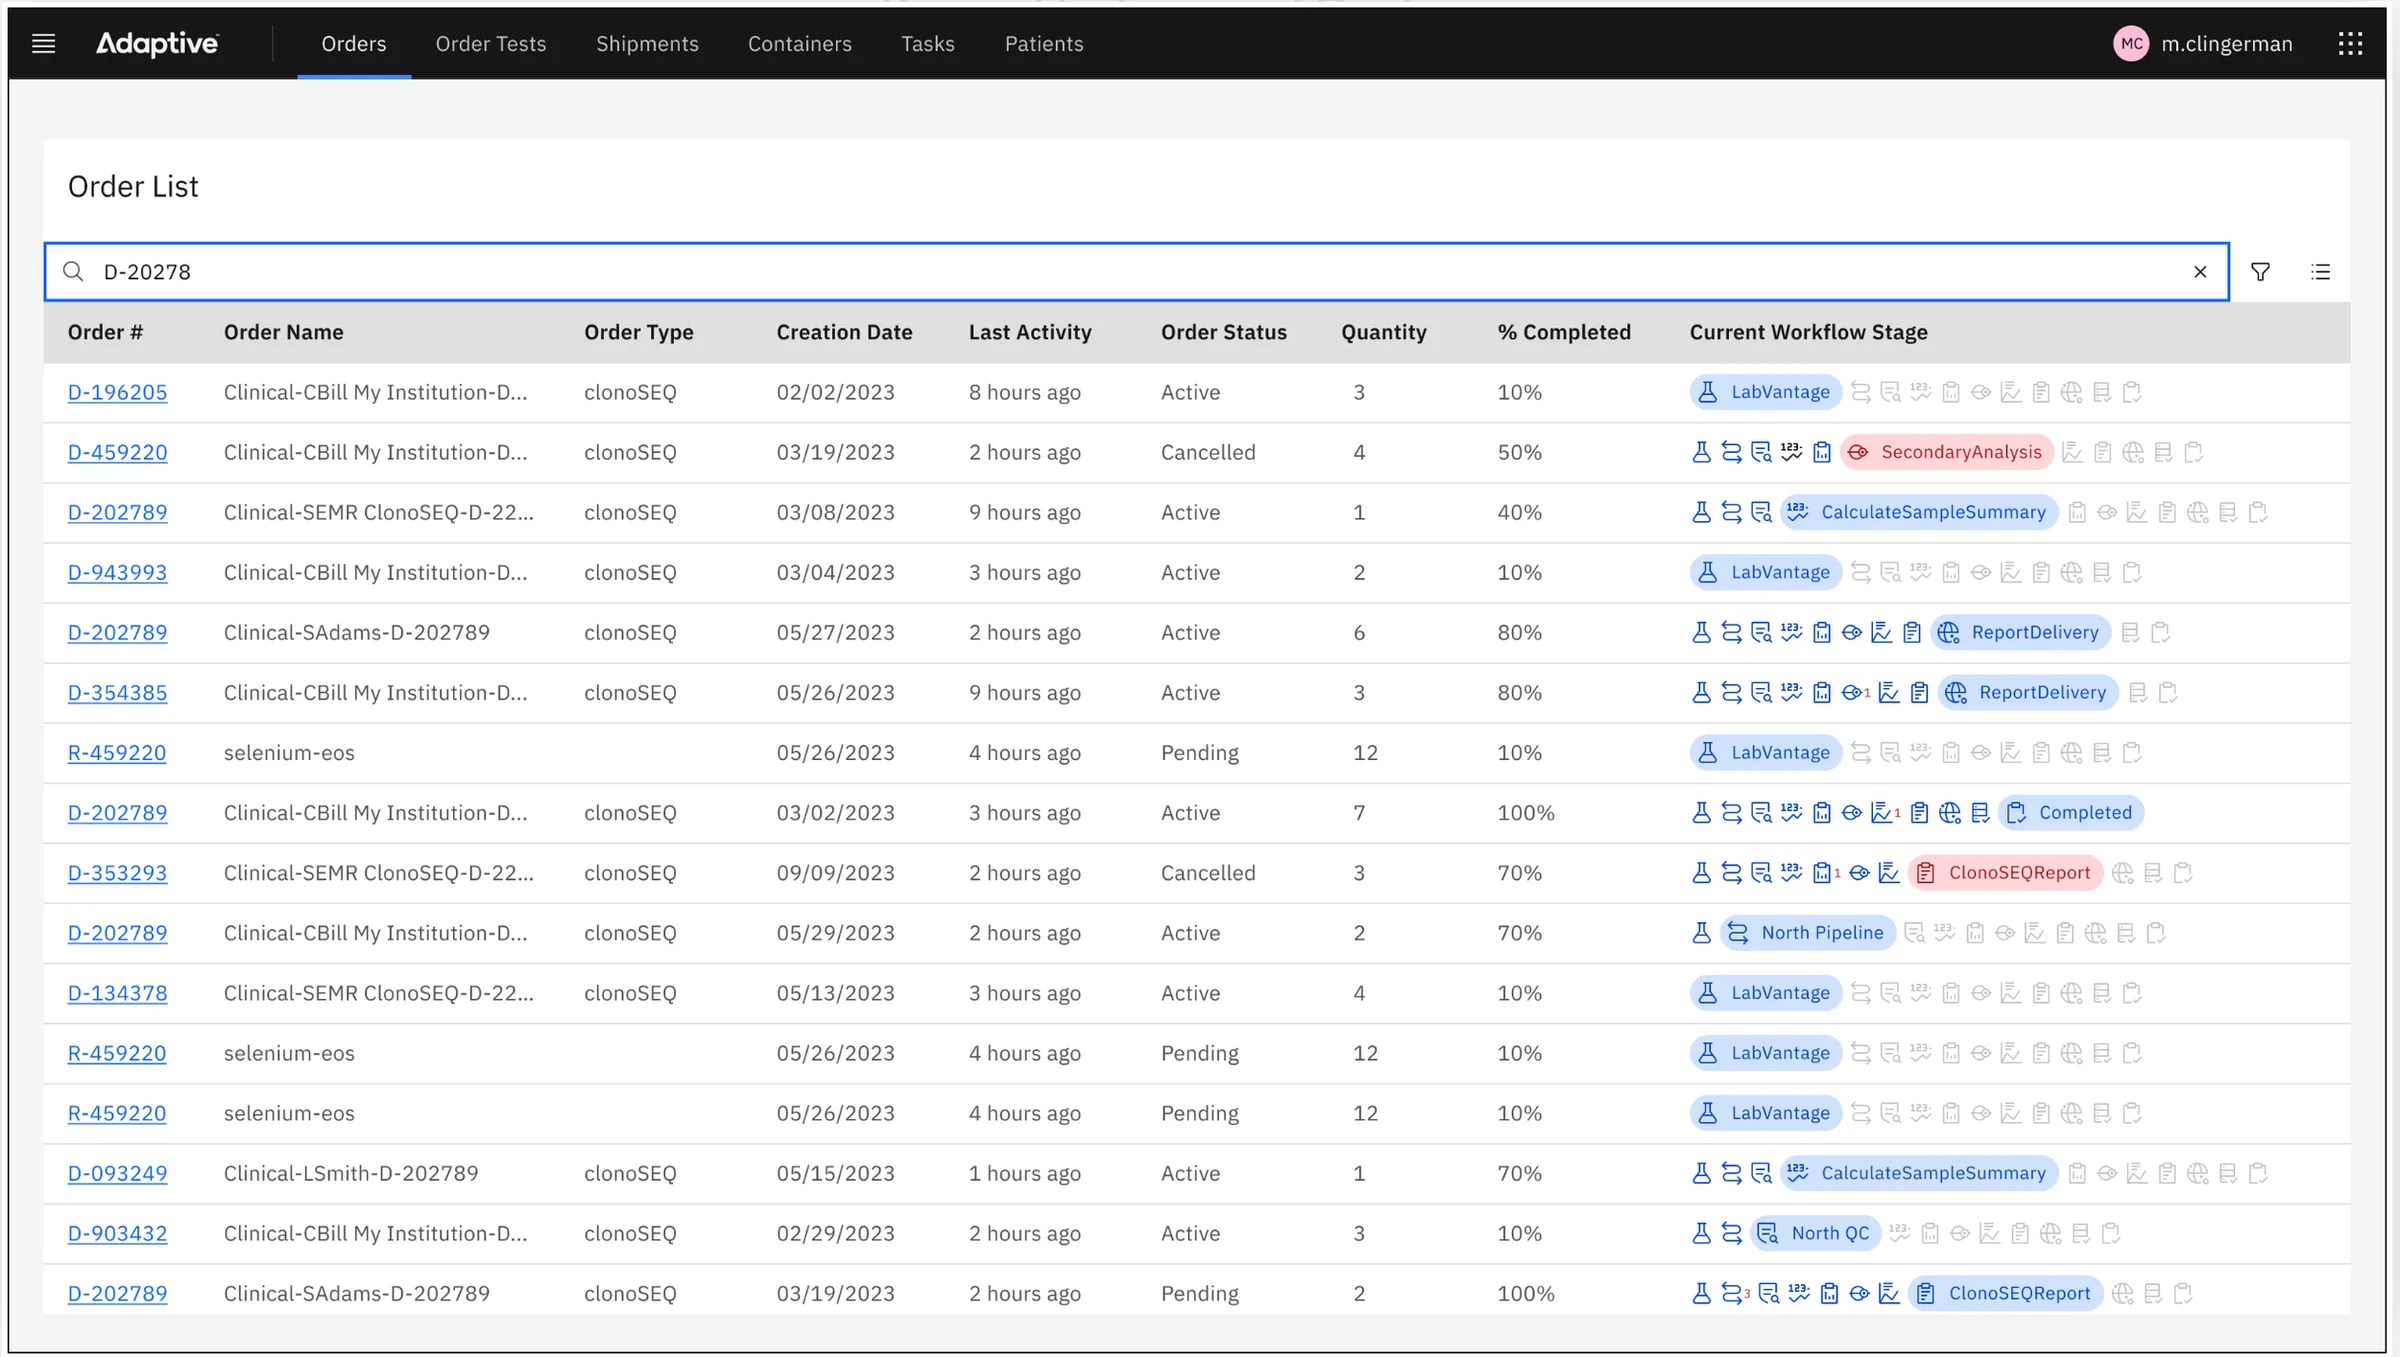
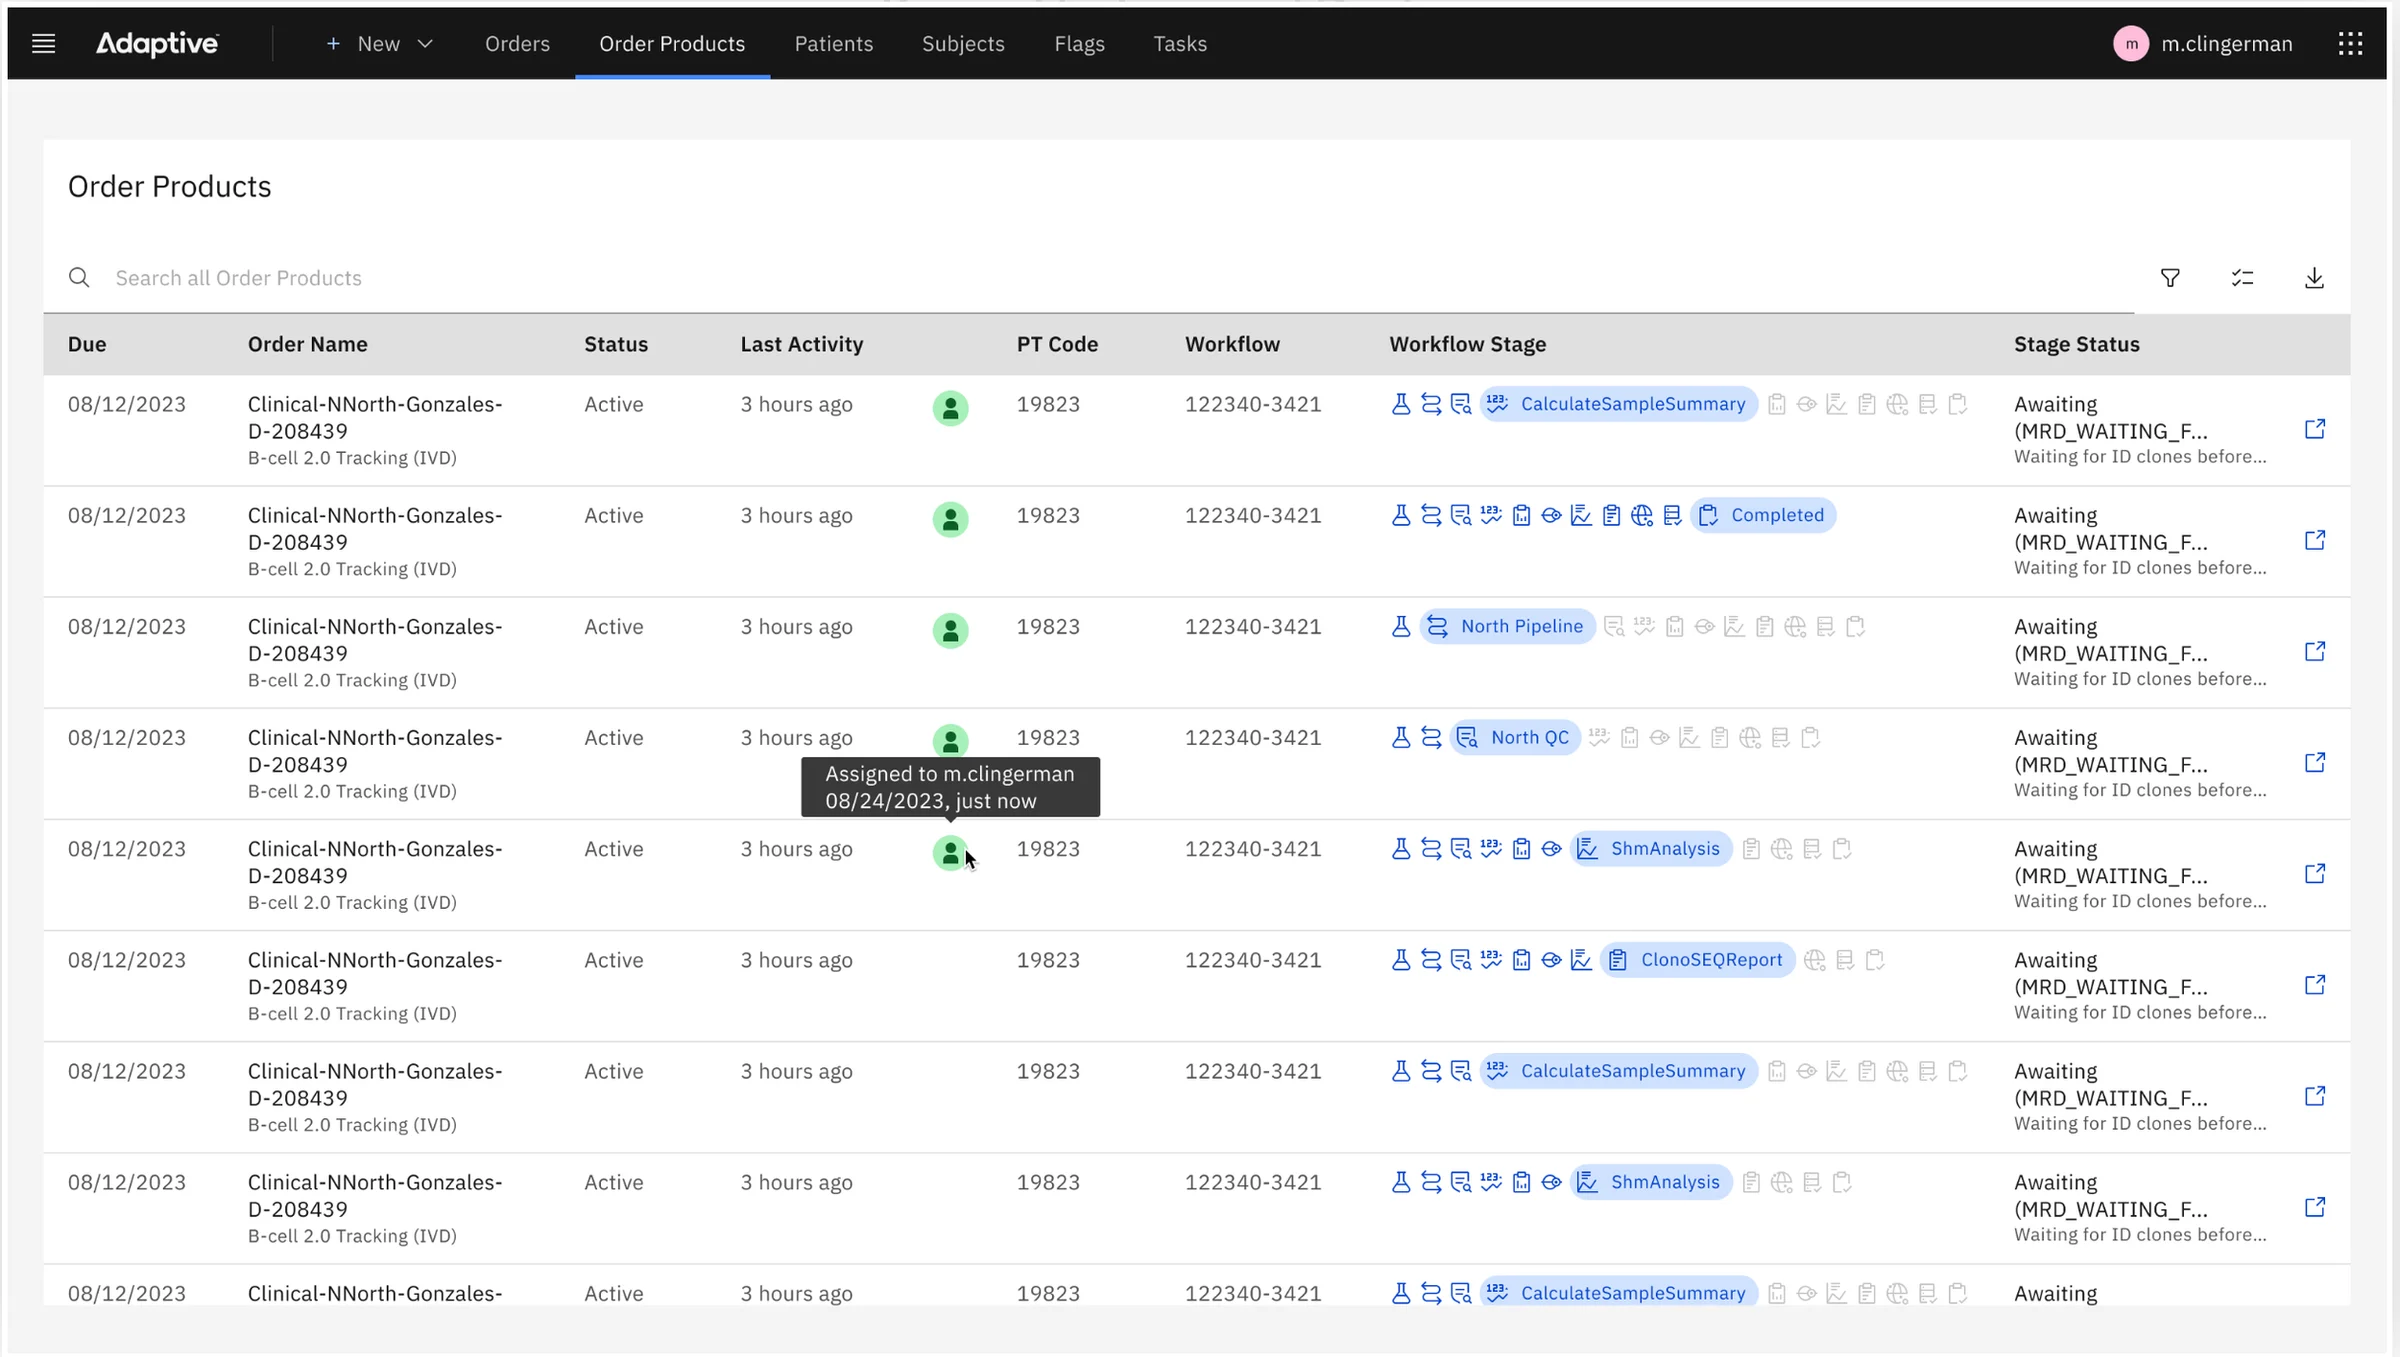
Analysts are expert spreadsheet users, so order data was surfaced in carefully designed tables, built on the open-source data table library adopted with Carbon:
- Columns chosen and ordered left to right so users see exactly the data they need.
- Tags, icons, color and an audit of human-readable labels so tables scan at a glance.
Search and filter
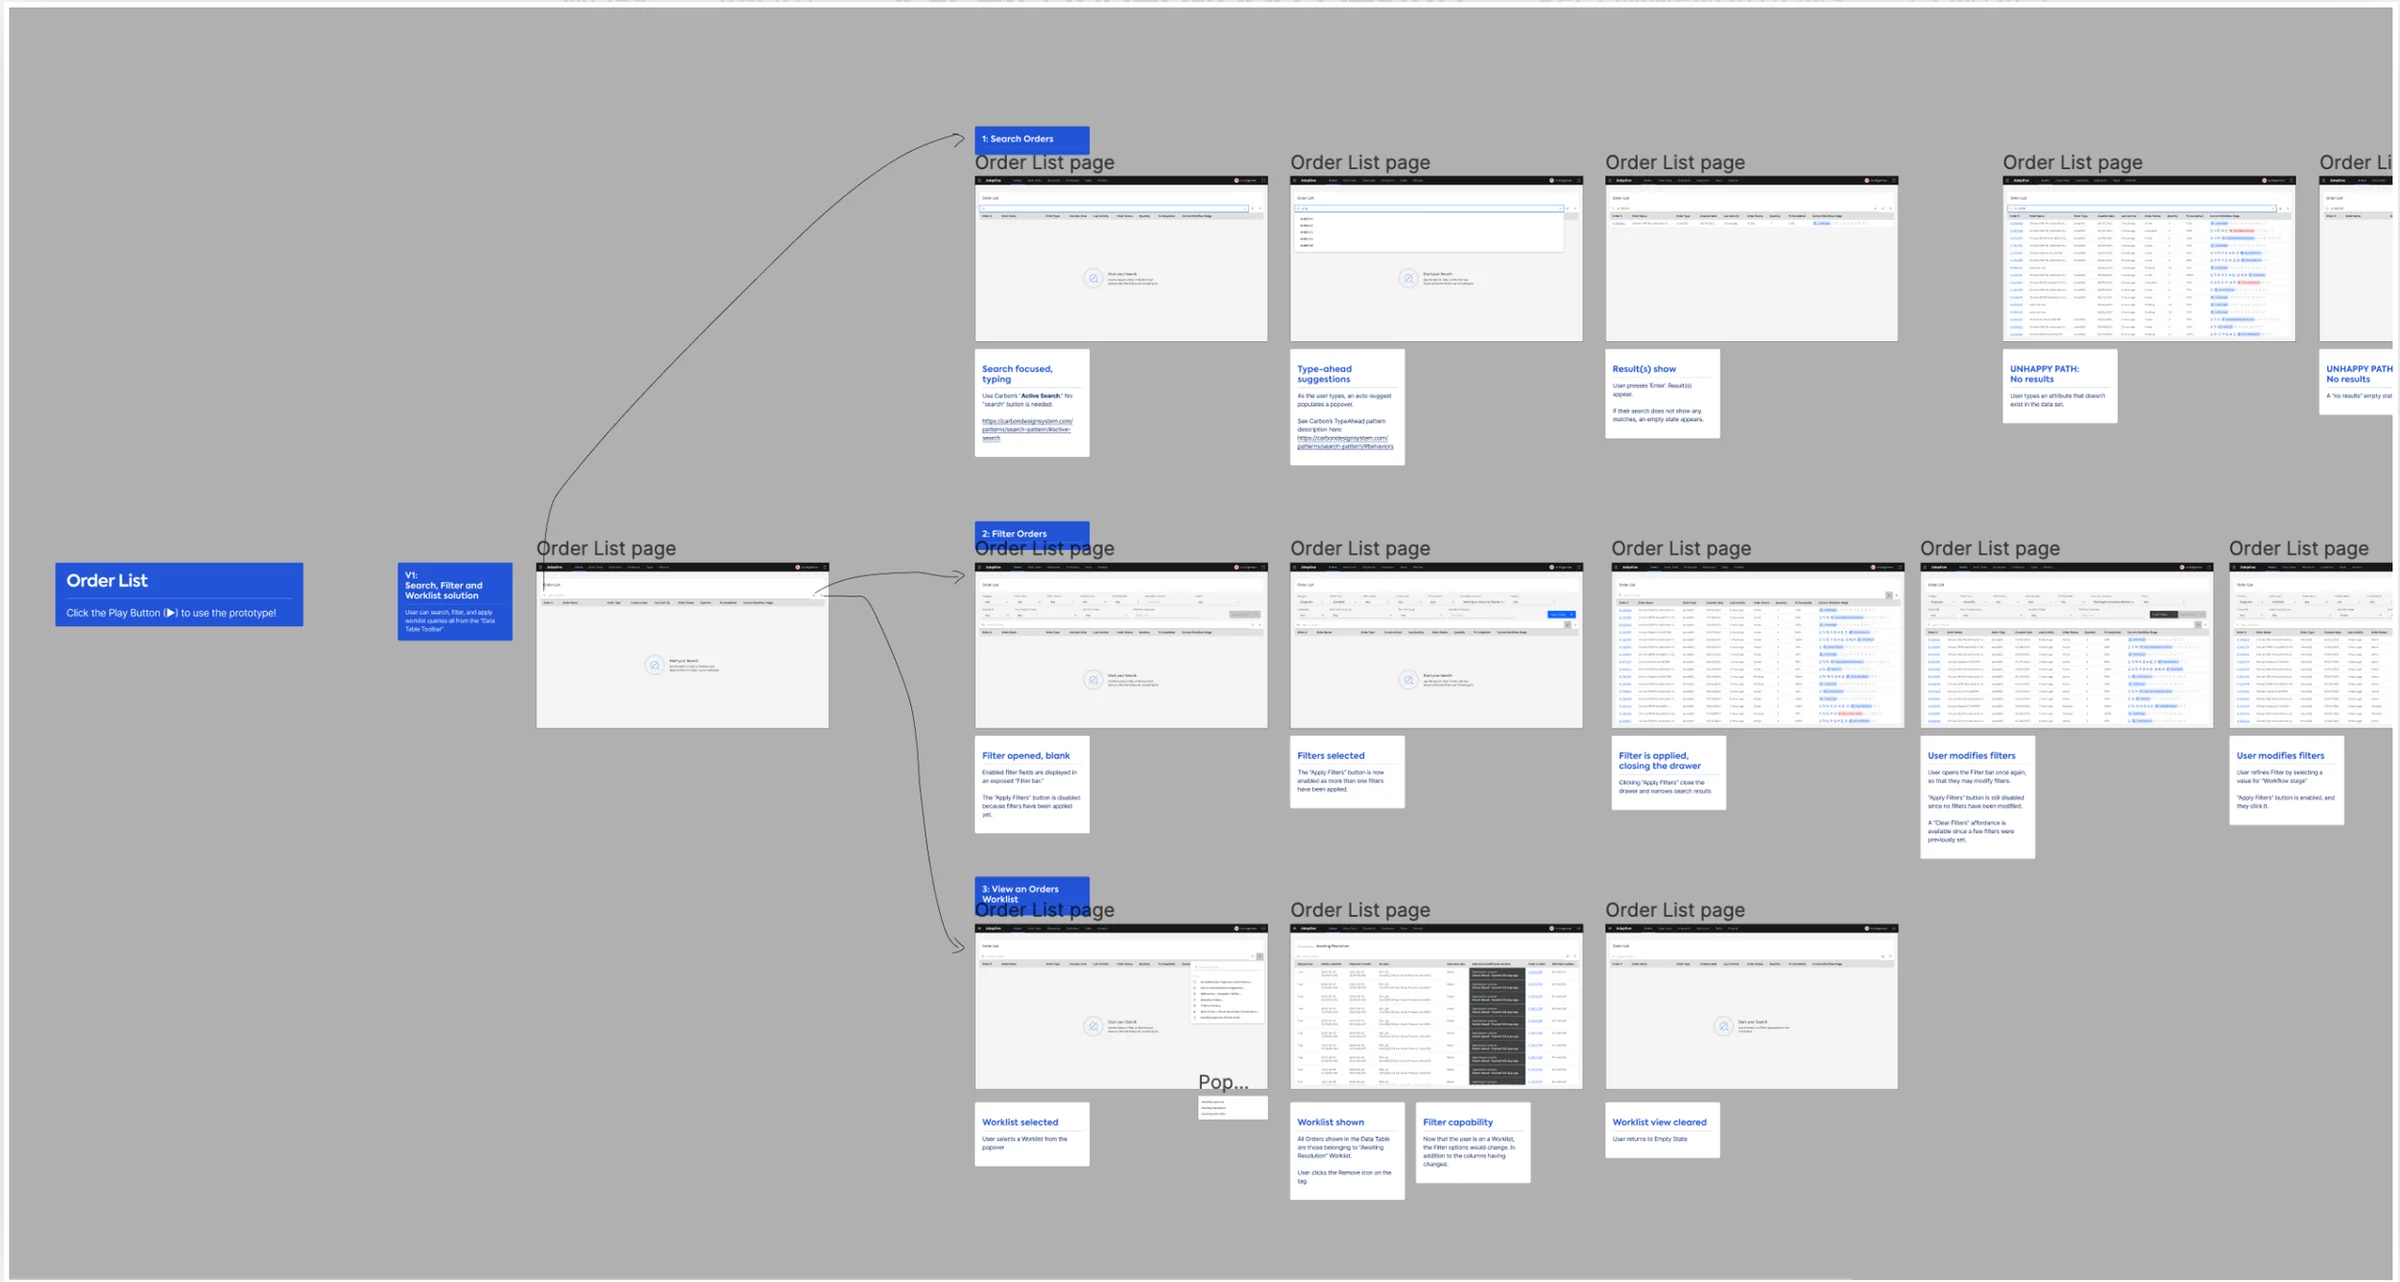
Every list (orders, patients, flags, specimens) combines Carbon's active search with a custom filter bar behind a filter button:
- No more loading everything. Lists open in an empty state that points to search and filters, which removed the latency of loading the full data set.
- Less data on the page. No workflow needed an unfiltered list. Nobody needs to see all orders, only, for example, active clinical trial orders.
- Filter bars for real personas. The SMEs helped pick the filter fields for each list, so each bar fits real scenarios.
From low fidelity to Figma
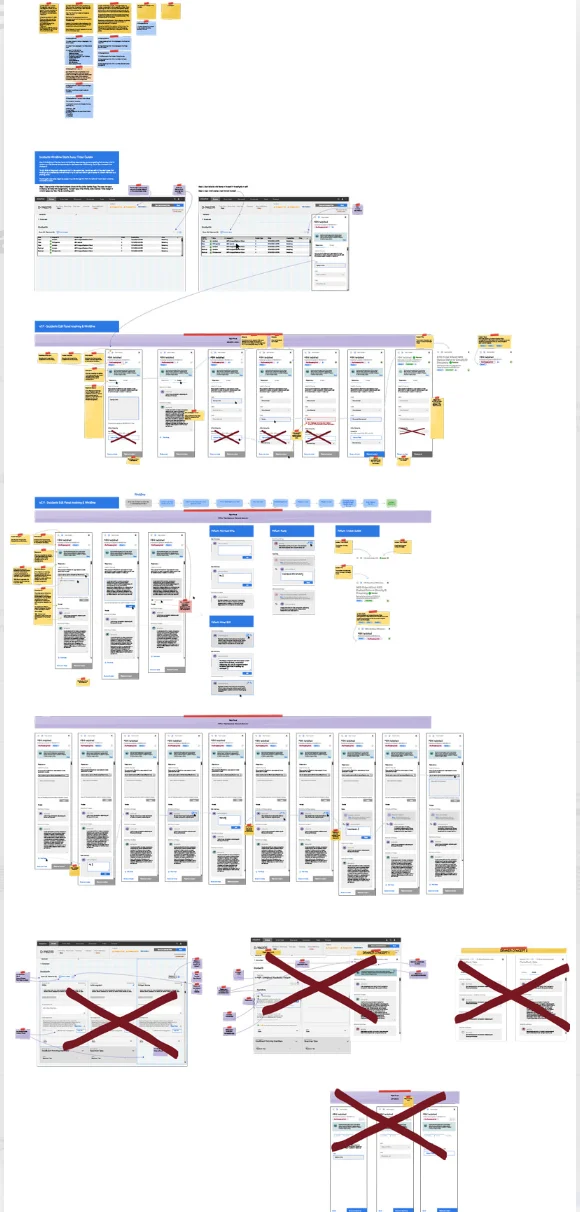
The work moved from low-fidelity decks and iterative wireframes, through flows designed with the SMEs and in Balsamiq, to state designs and high-fidelity Figma screens for Flags cards, flows and states, and finally sprint handoffs.
Impact
Dense pages kept every field and became easier to scan, issues gained one home where they could be worked beside the data, and list screens loaded faster and showed only what the work needed.
Skills: UX Design, Interaction Design, Design Systems, Information Architecture, Rapid Prototyping.