IT Security, Data Visualization, ML
OpSec: Rethinking Marketplace IT Security for Analysts
A multi-year redesign of OpSec's marketplace brand-protection platform, cutting analyst cognitive load across dense data grids, then layering graph-based threat intelligence, a customizable HUD, and transparent ML tagging.
OpSec Security

- 01 Problem
Analysts fought 180+ column data grids, horizontal scrolling, and inconsistent interfaces, while customers lost trust over latency and the inability to see predictive patterns.
- 02 Approach
Design thinking, Lean Six Sigma, and ethnographic research drove four connected efforts: research/grids, network-intelligence graph viz, a customizable HUD, and open-box ML tagging.
- 03 Outcome
A visual-first platform that moved analysts beyond data tables into predictive enforcement, with ML tagging reporting efficiency gains up to 62%.
From the sketchbook
Paper pad and marker, before any pixels.
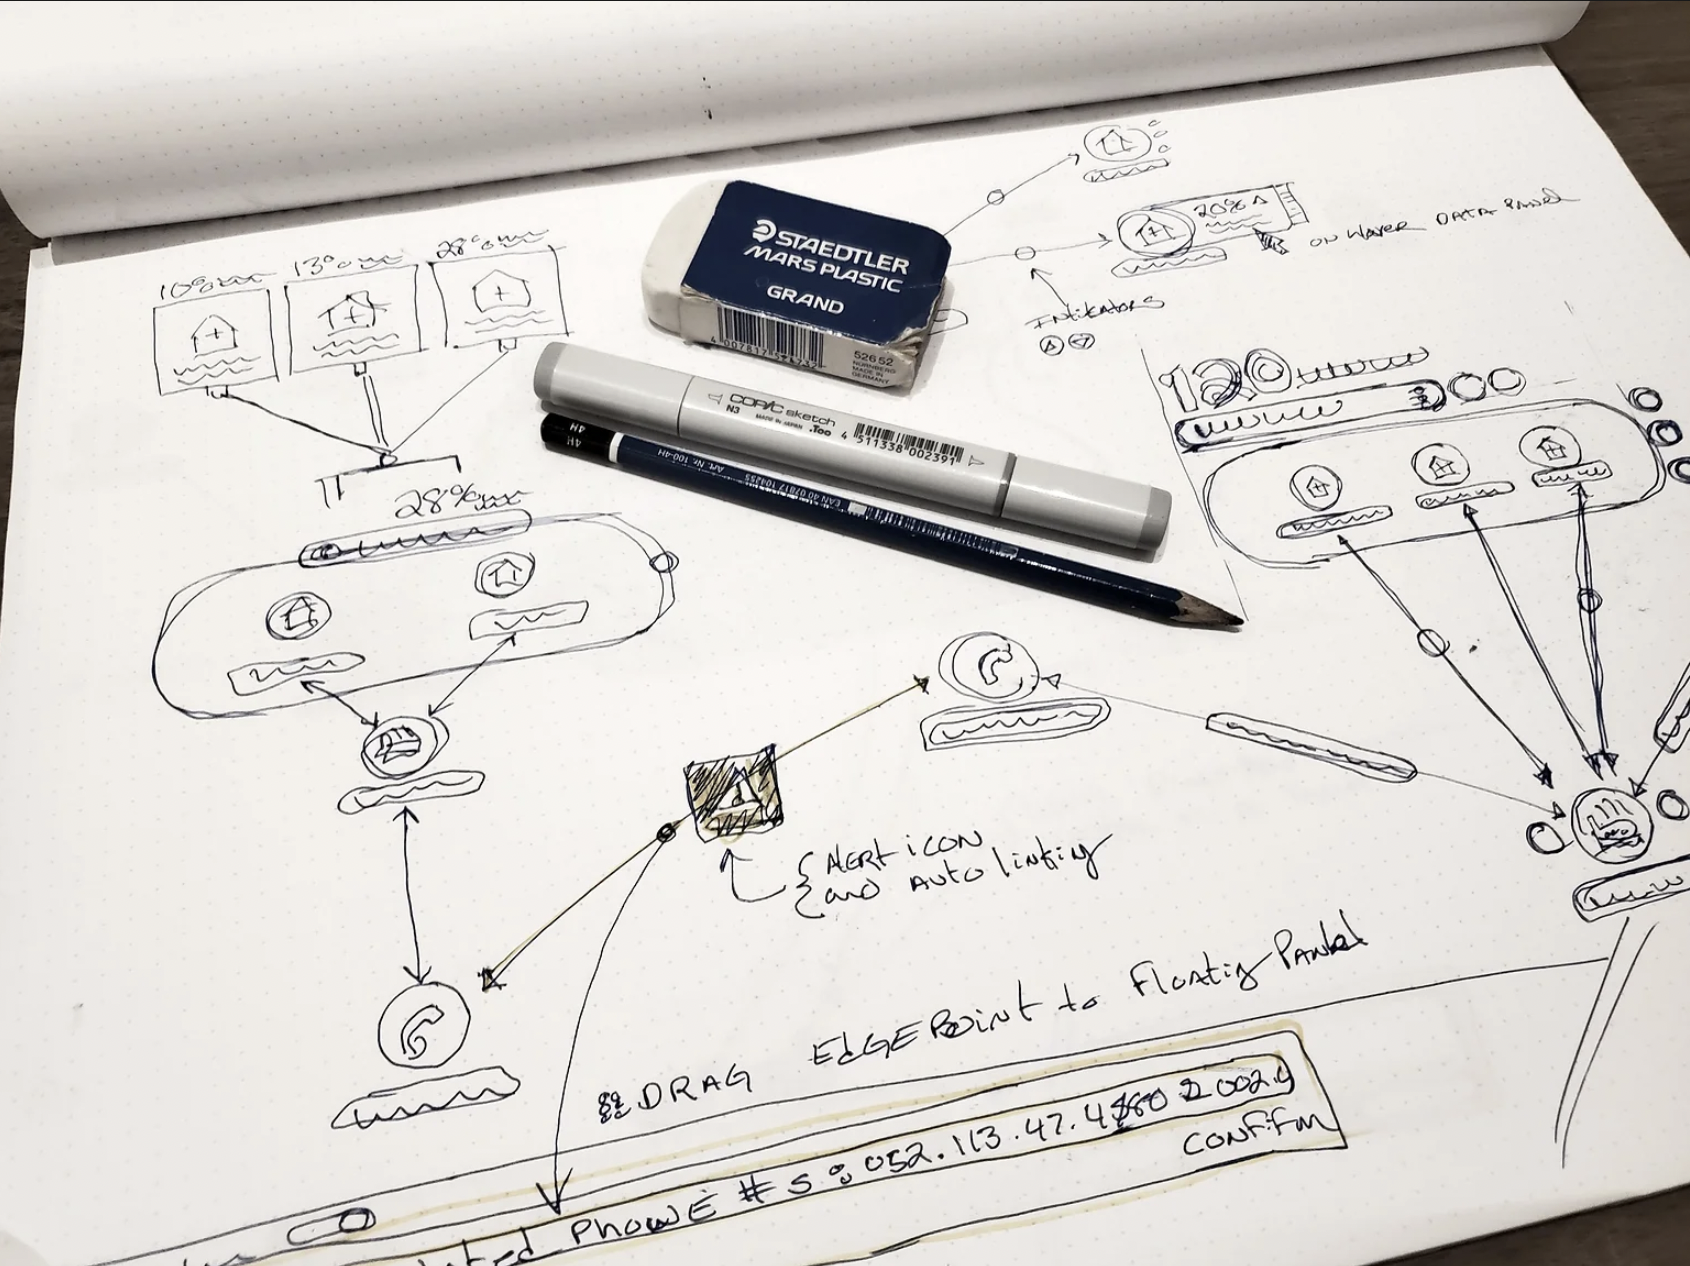
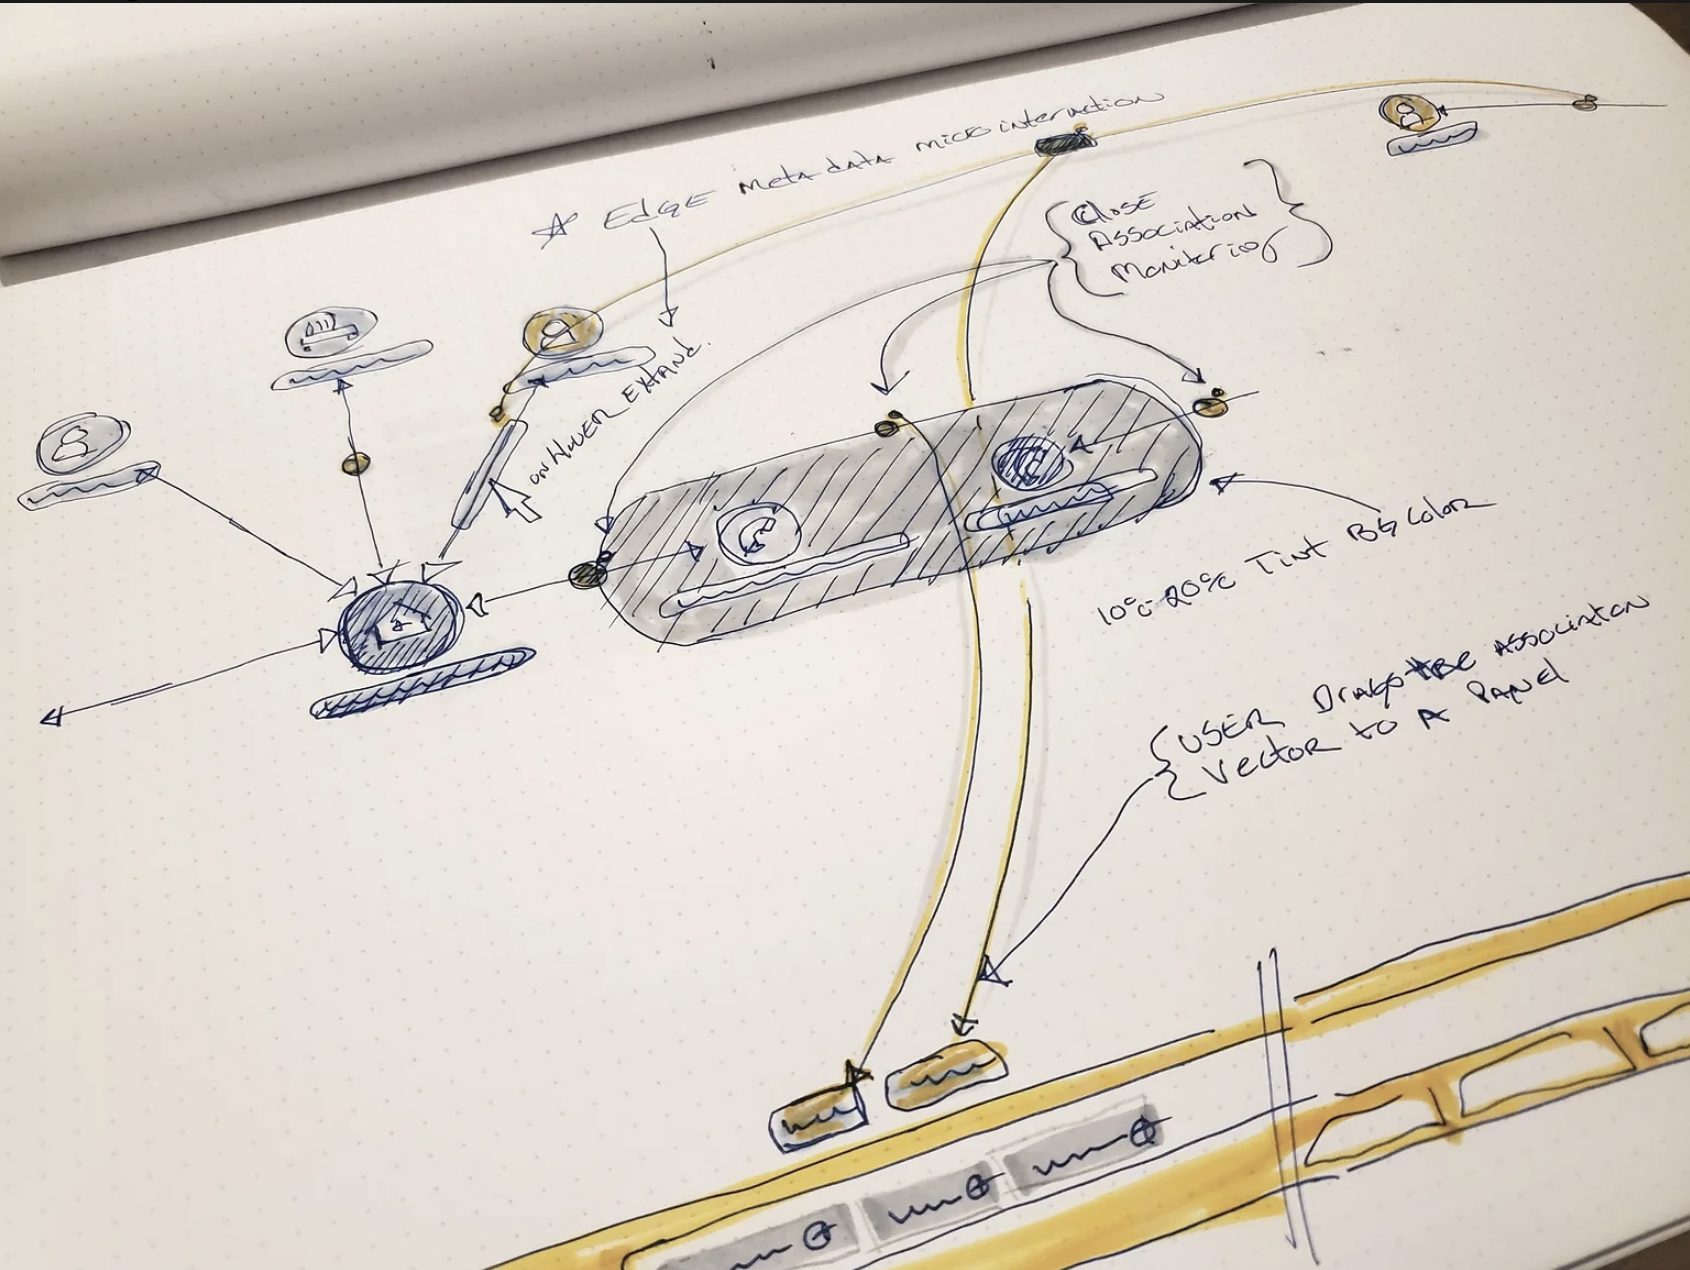


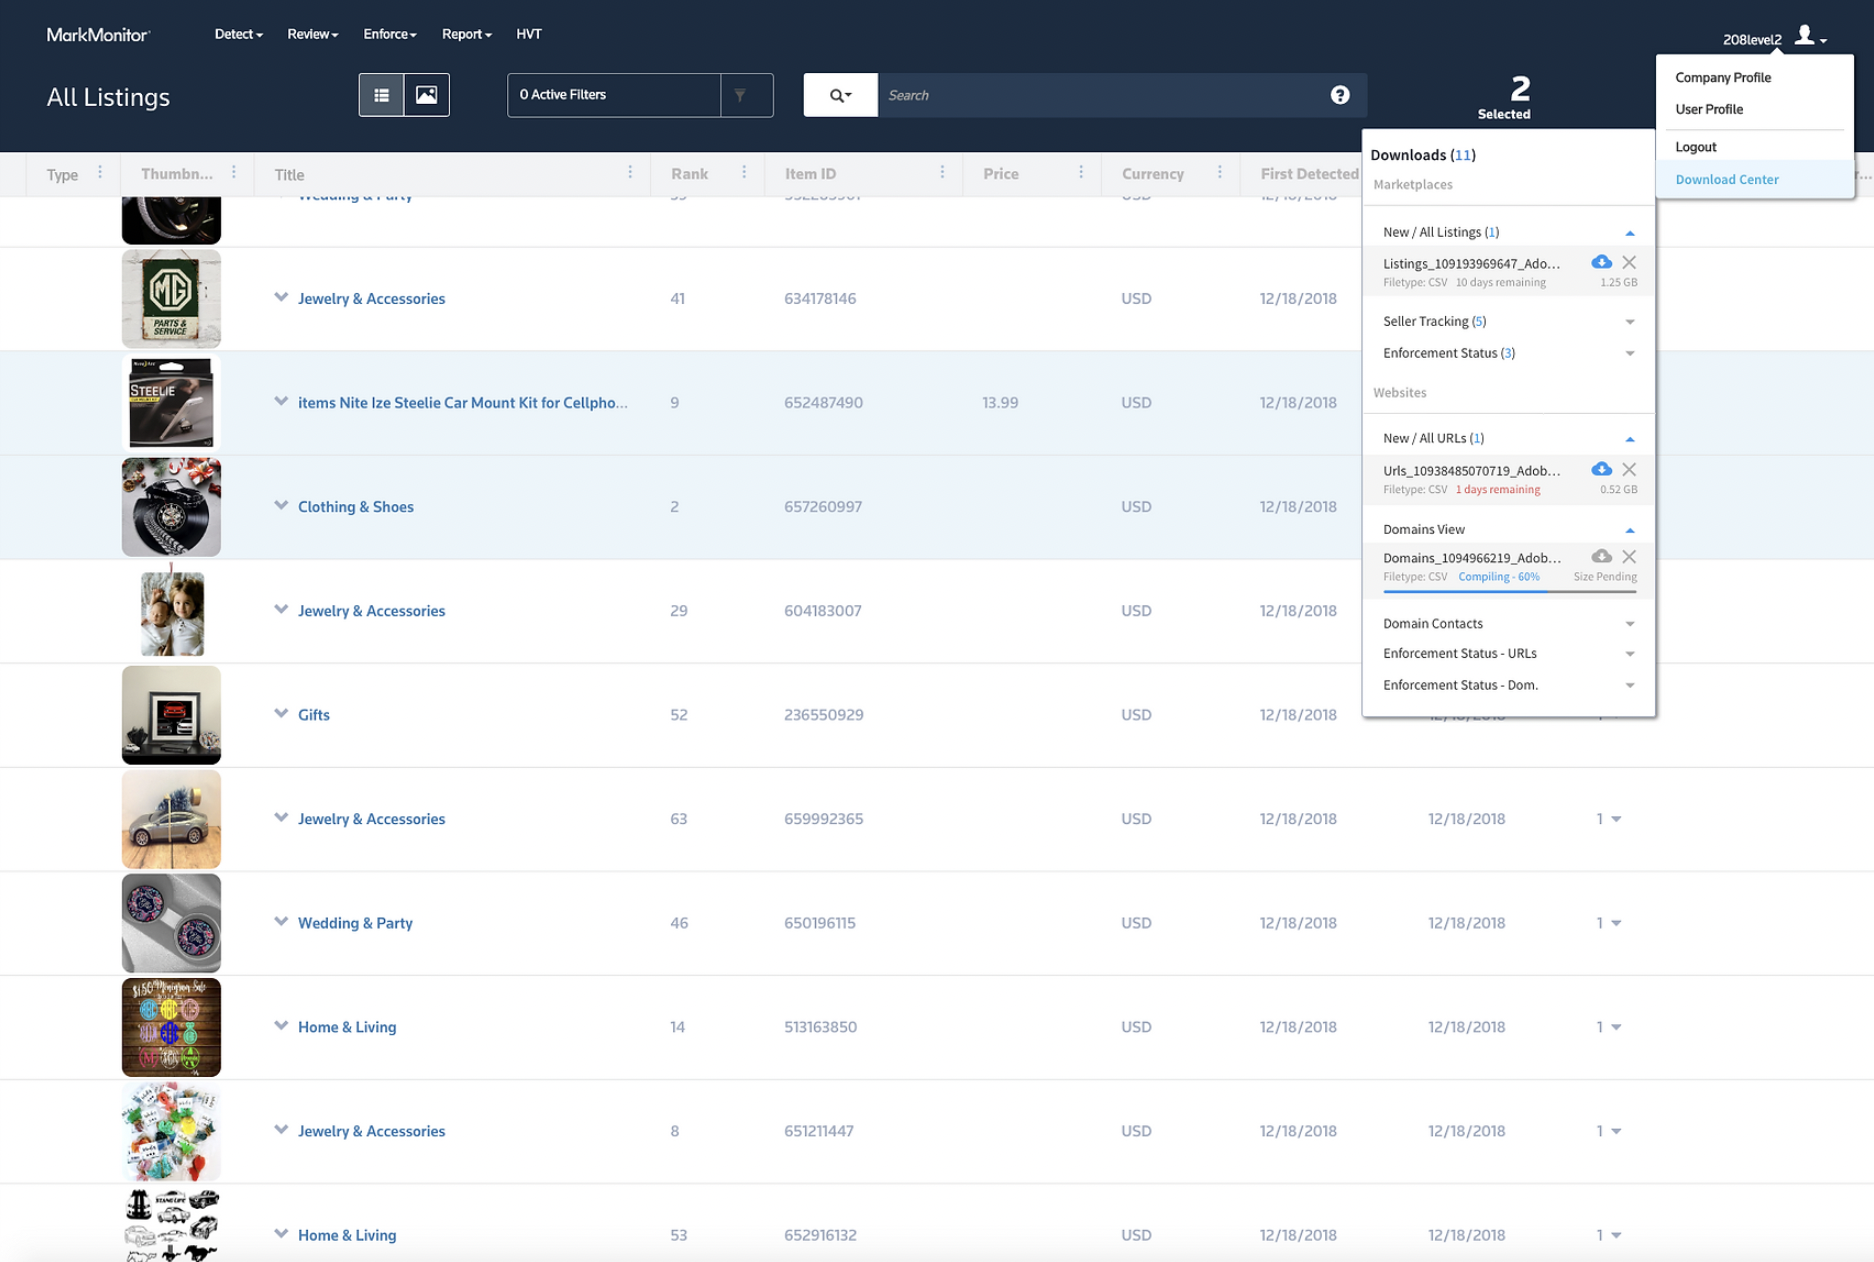
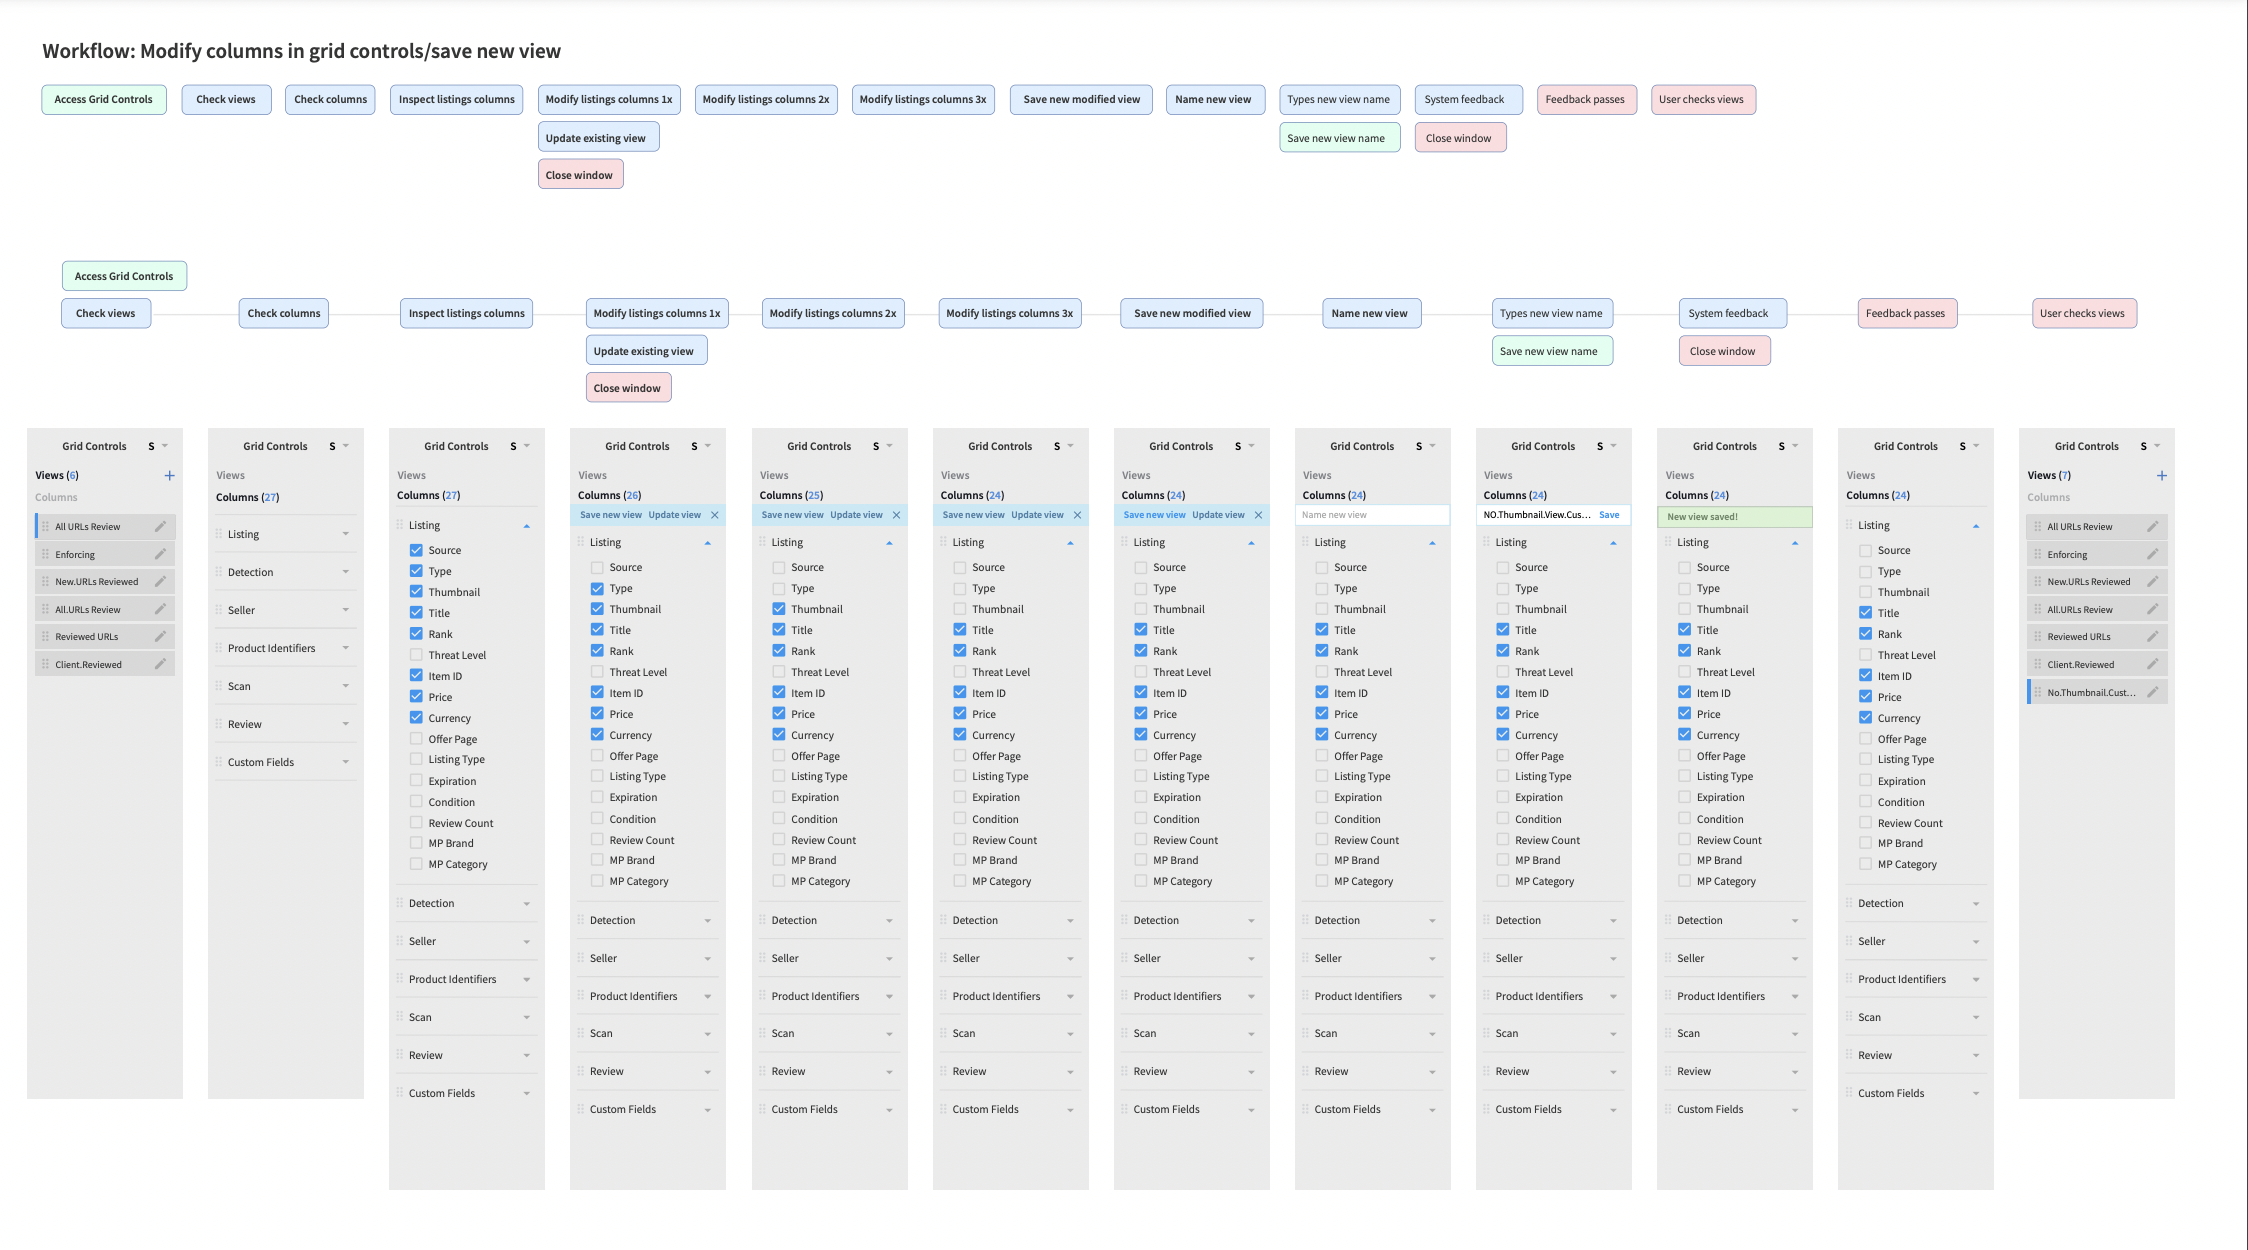
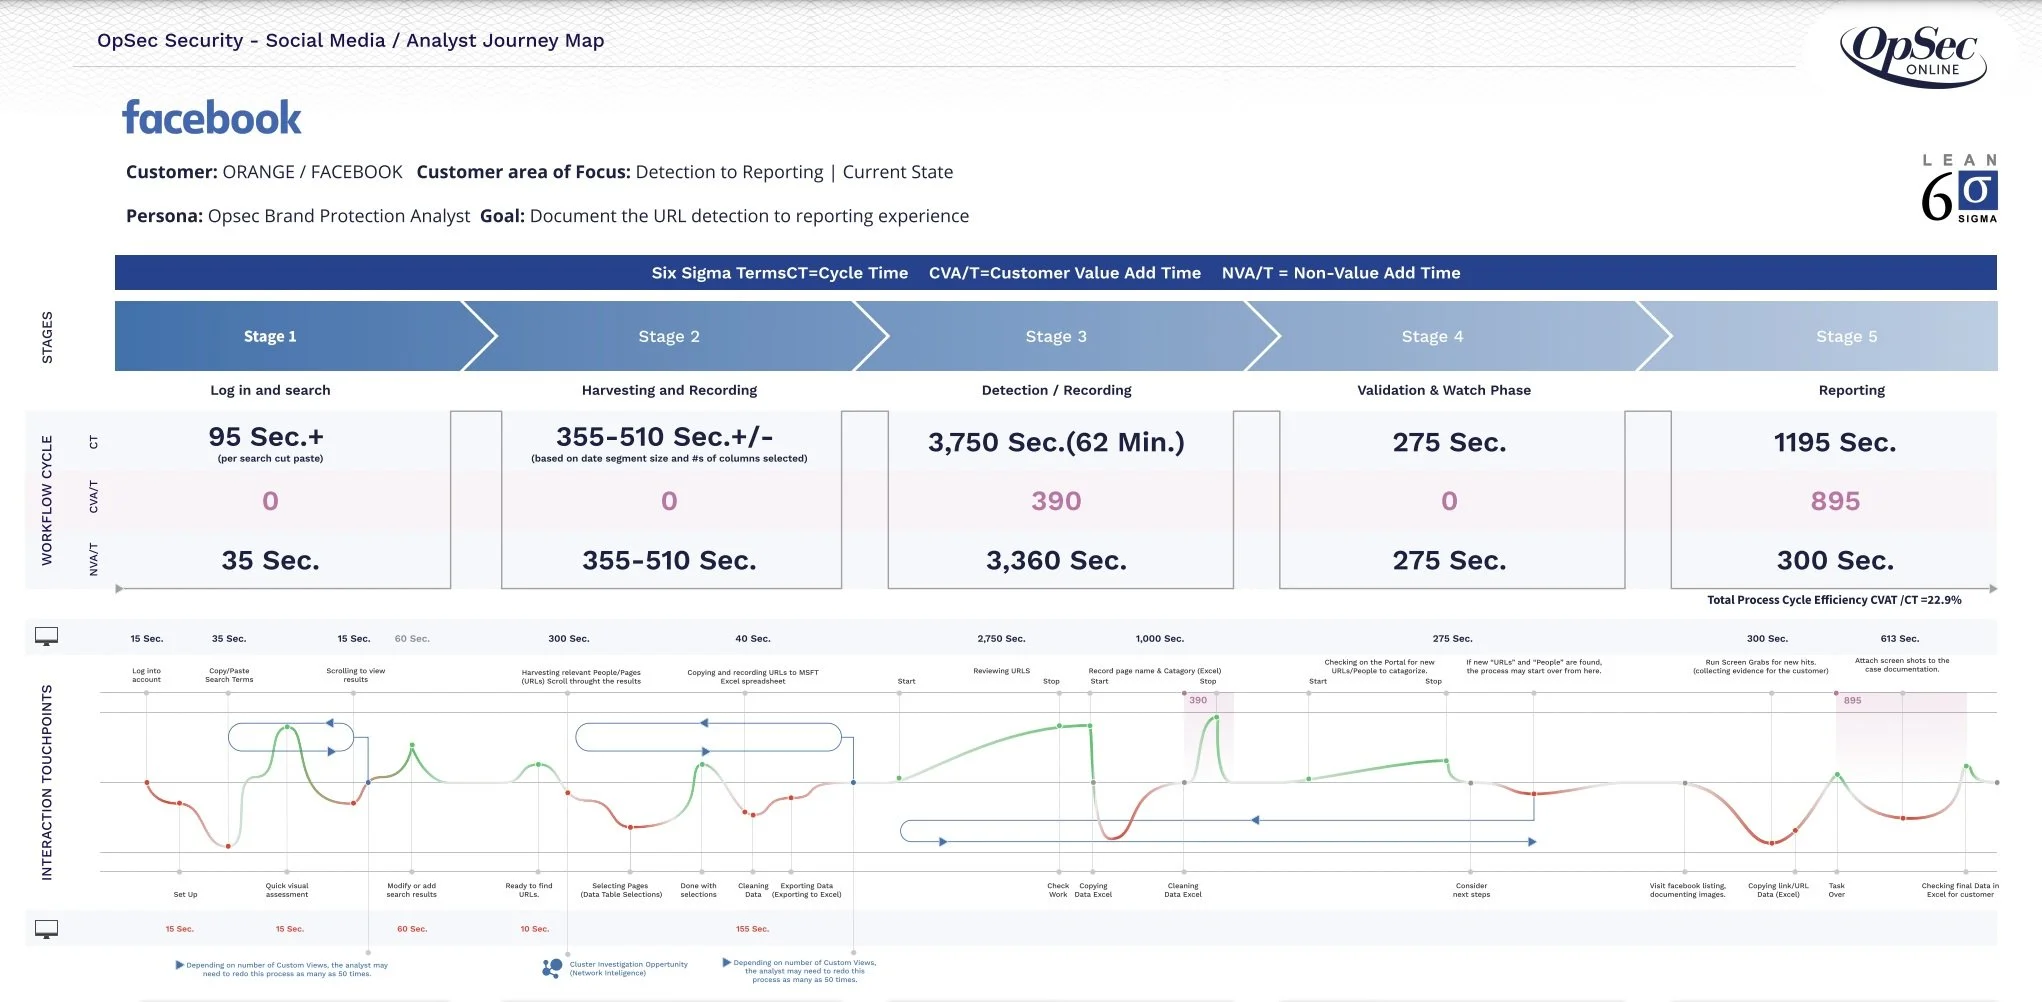
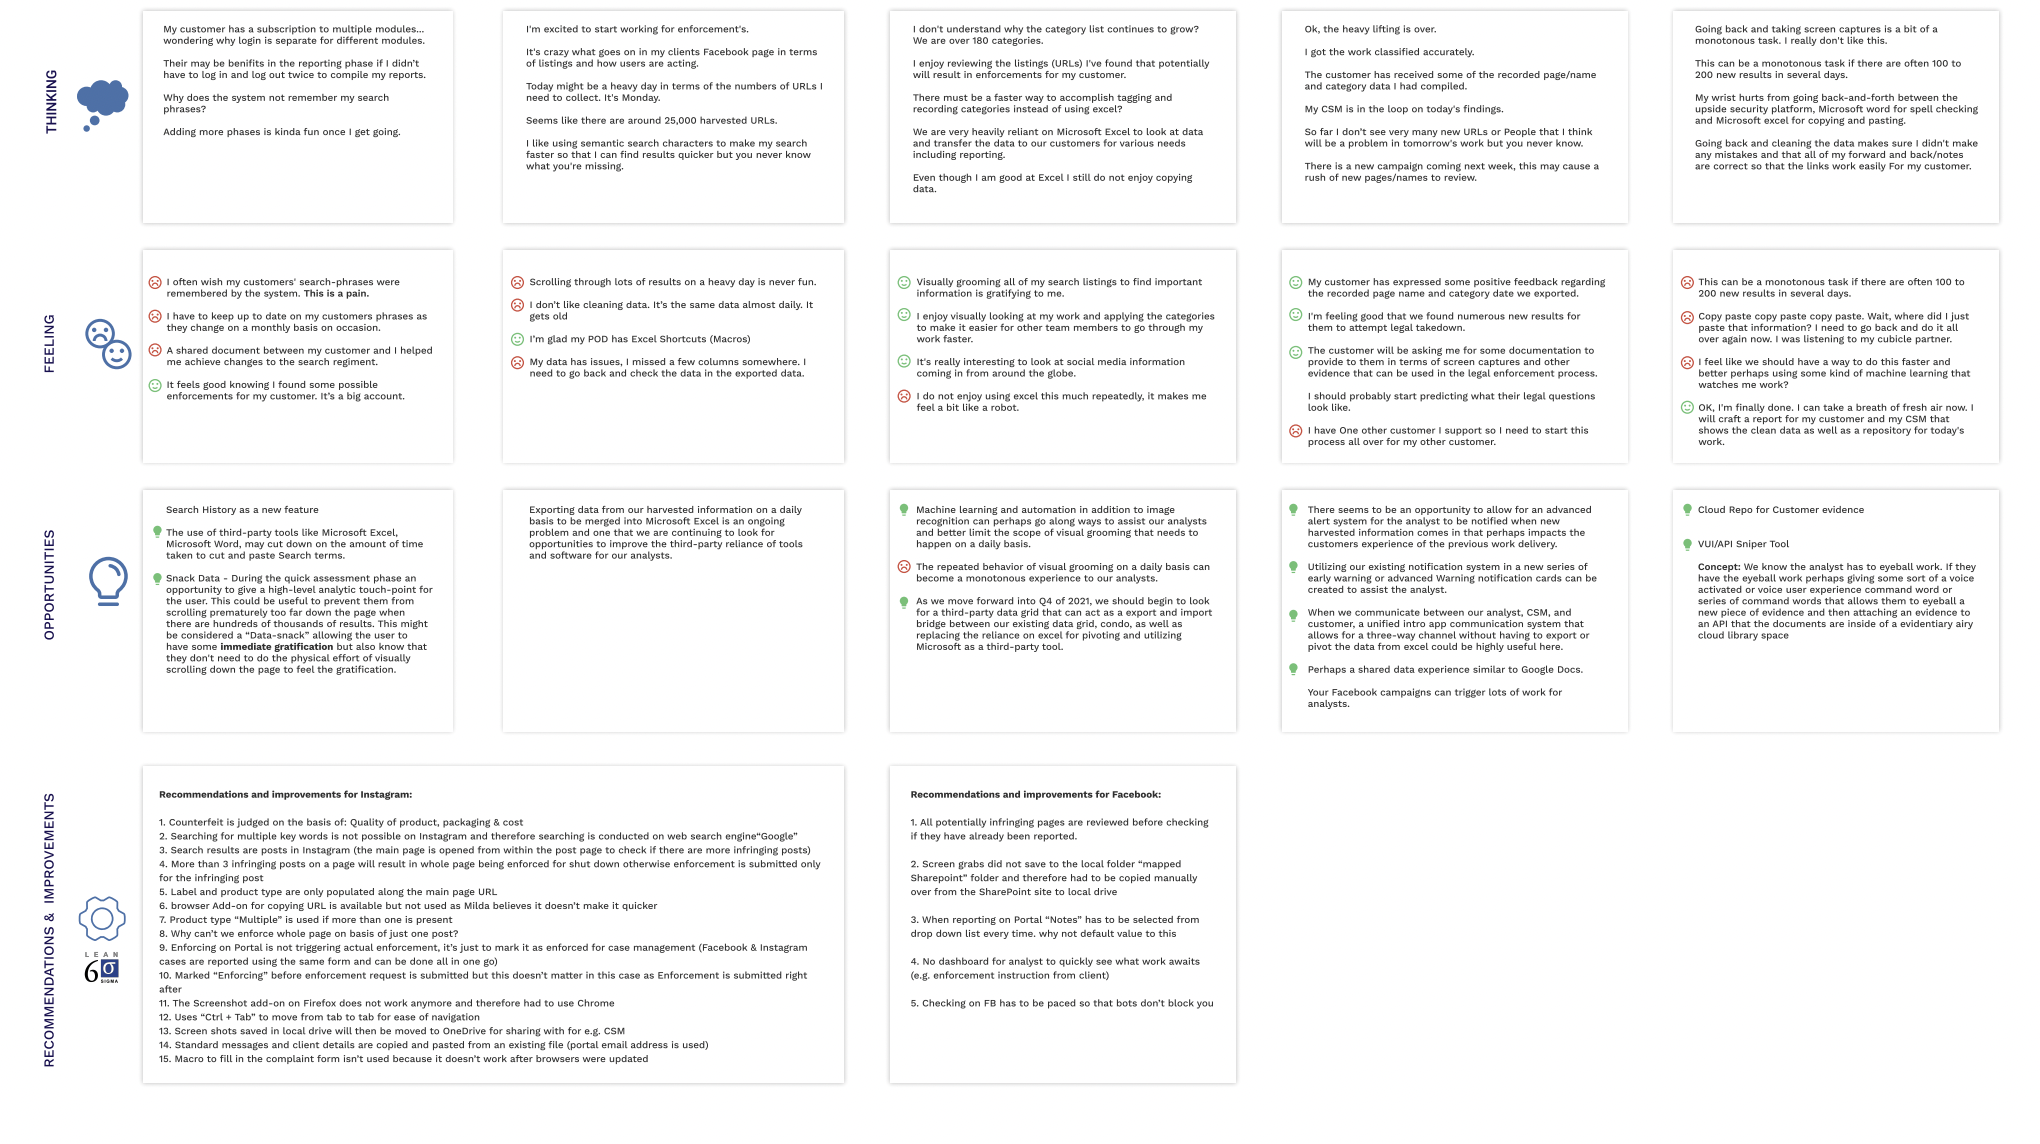
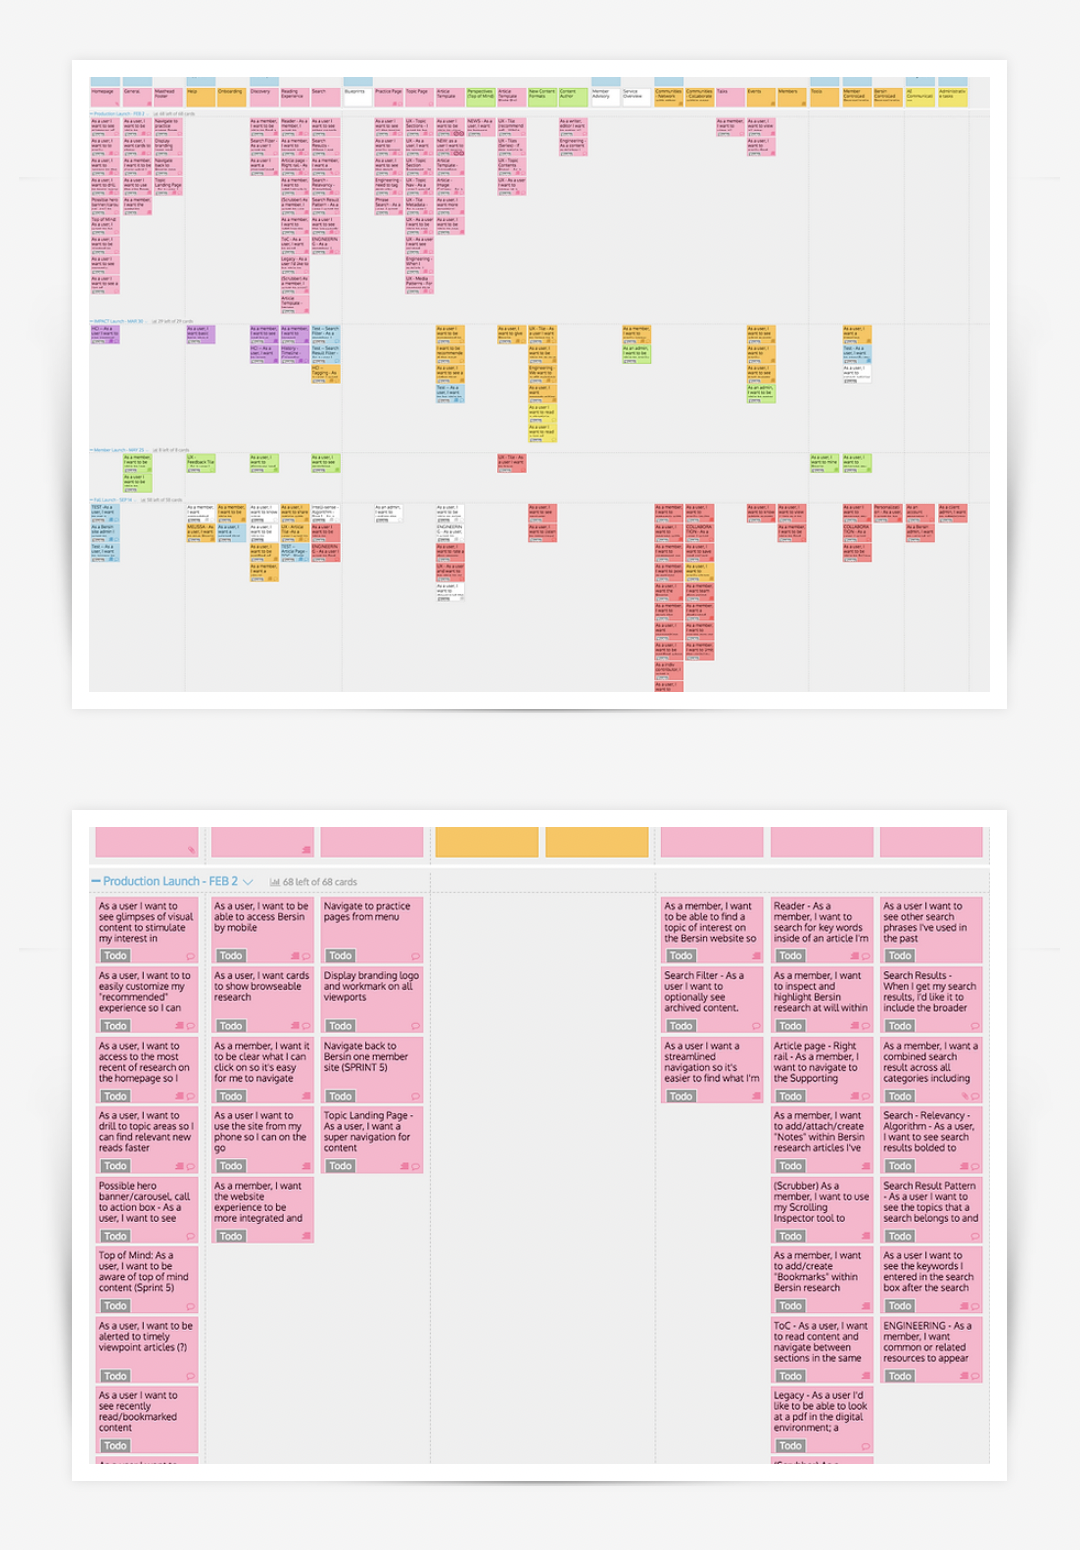
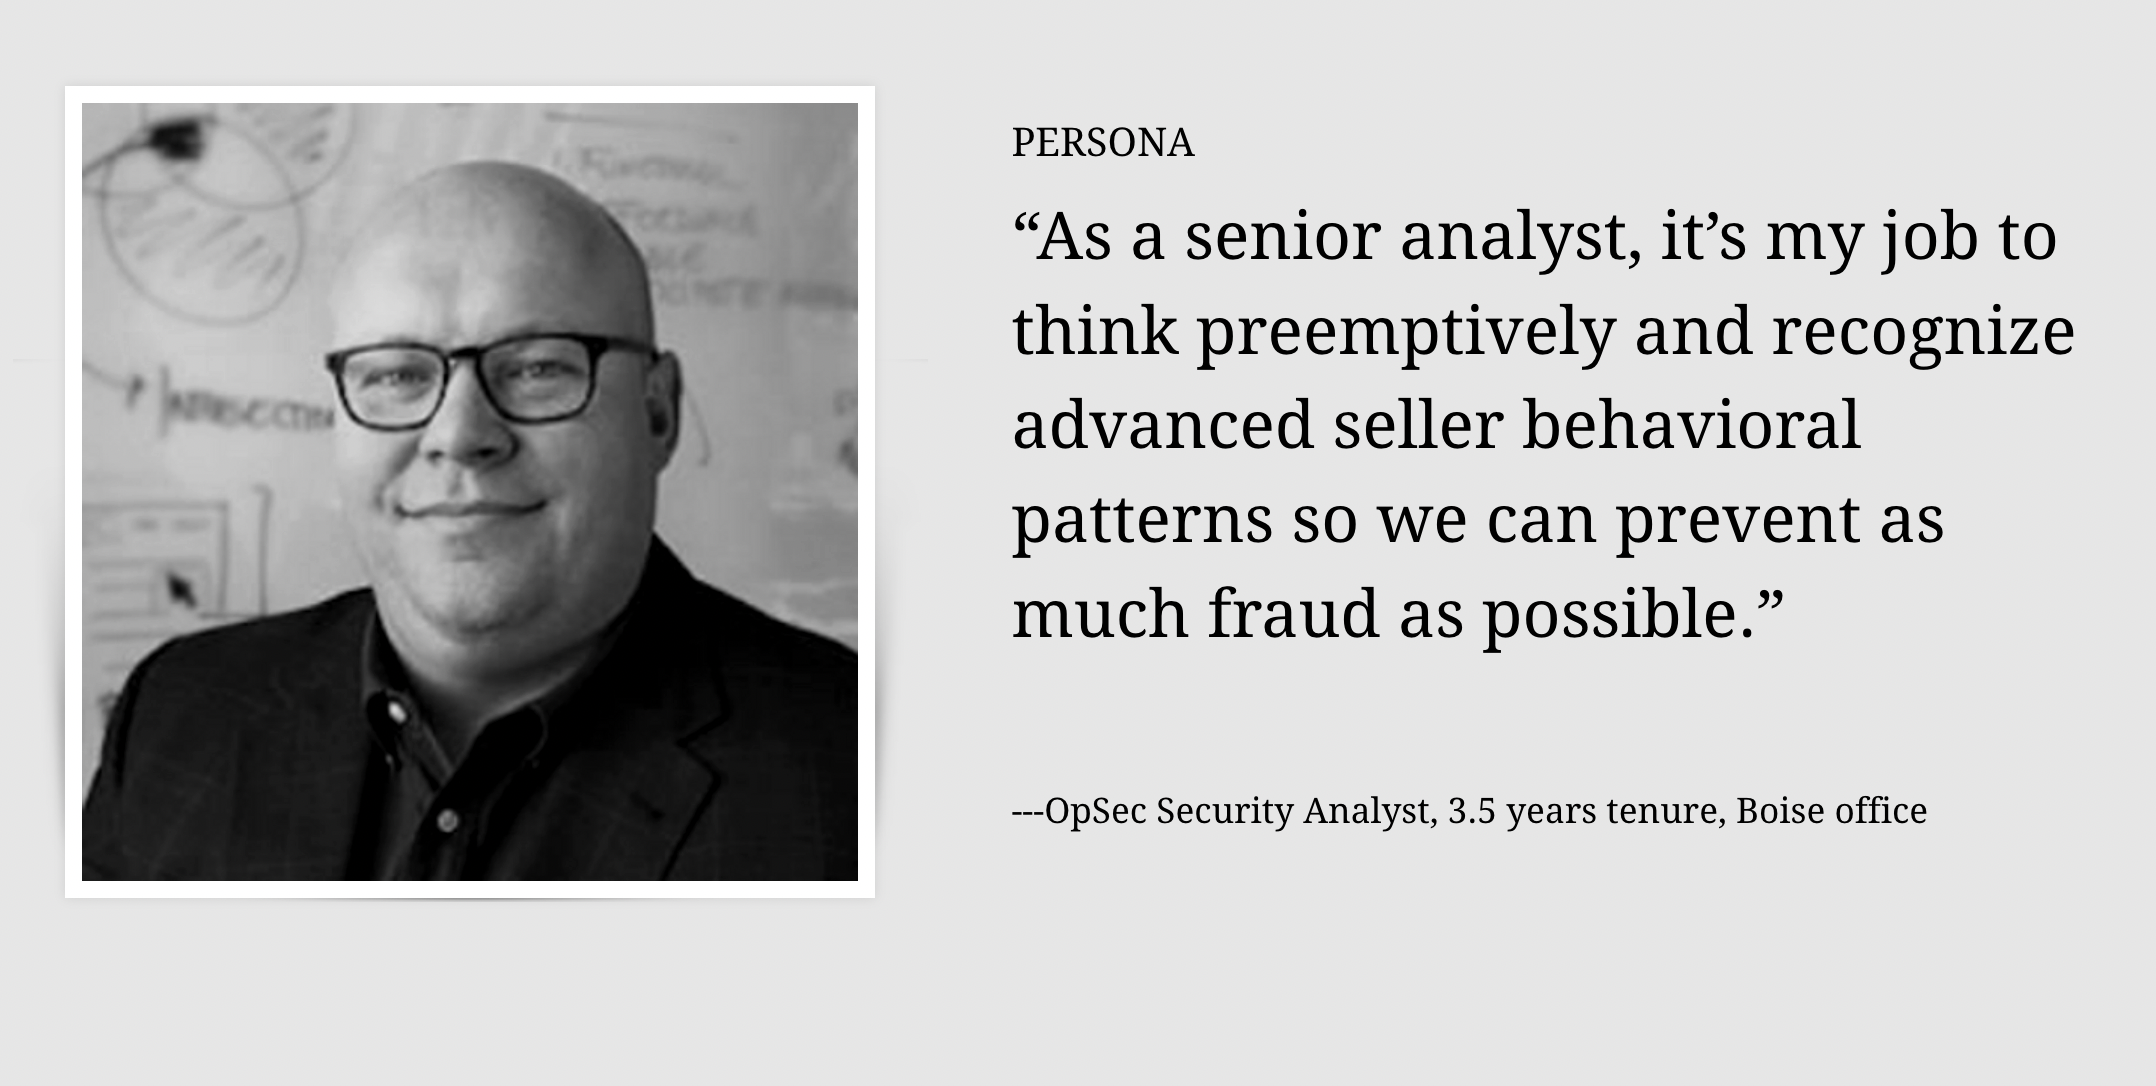

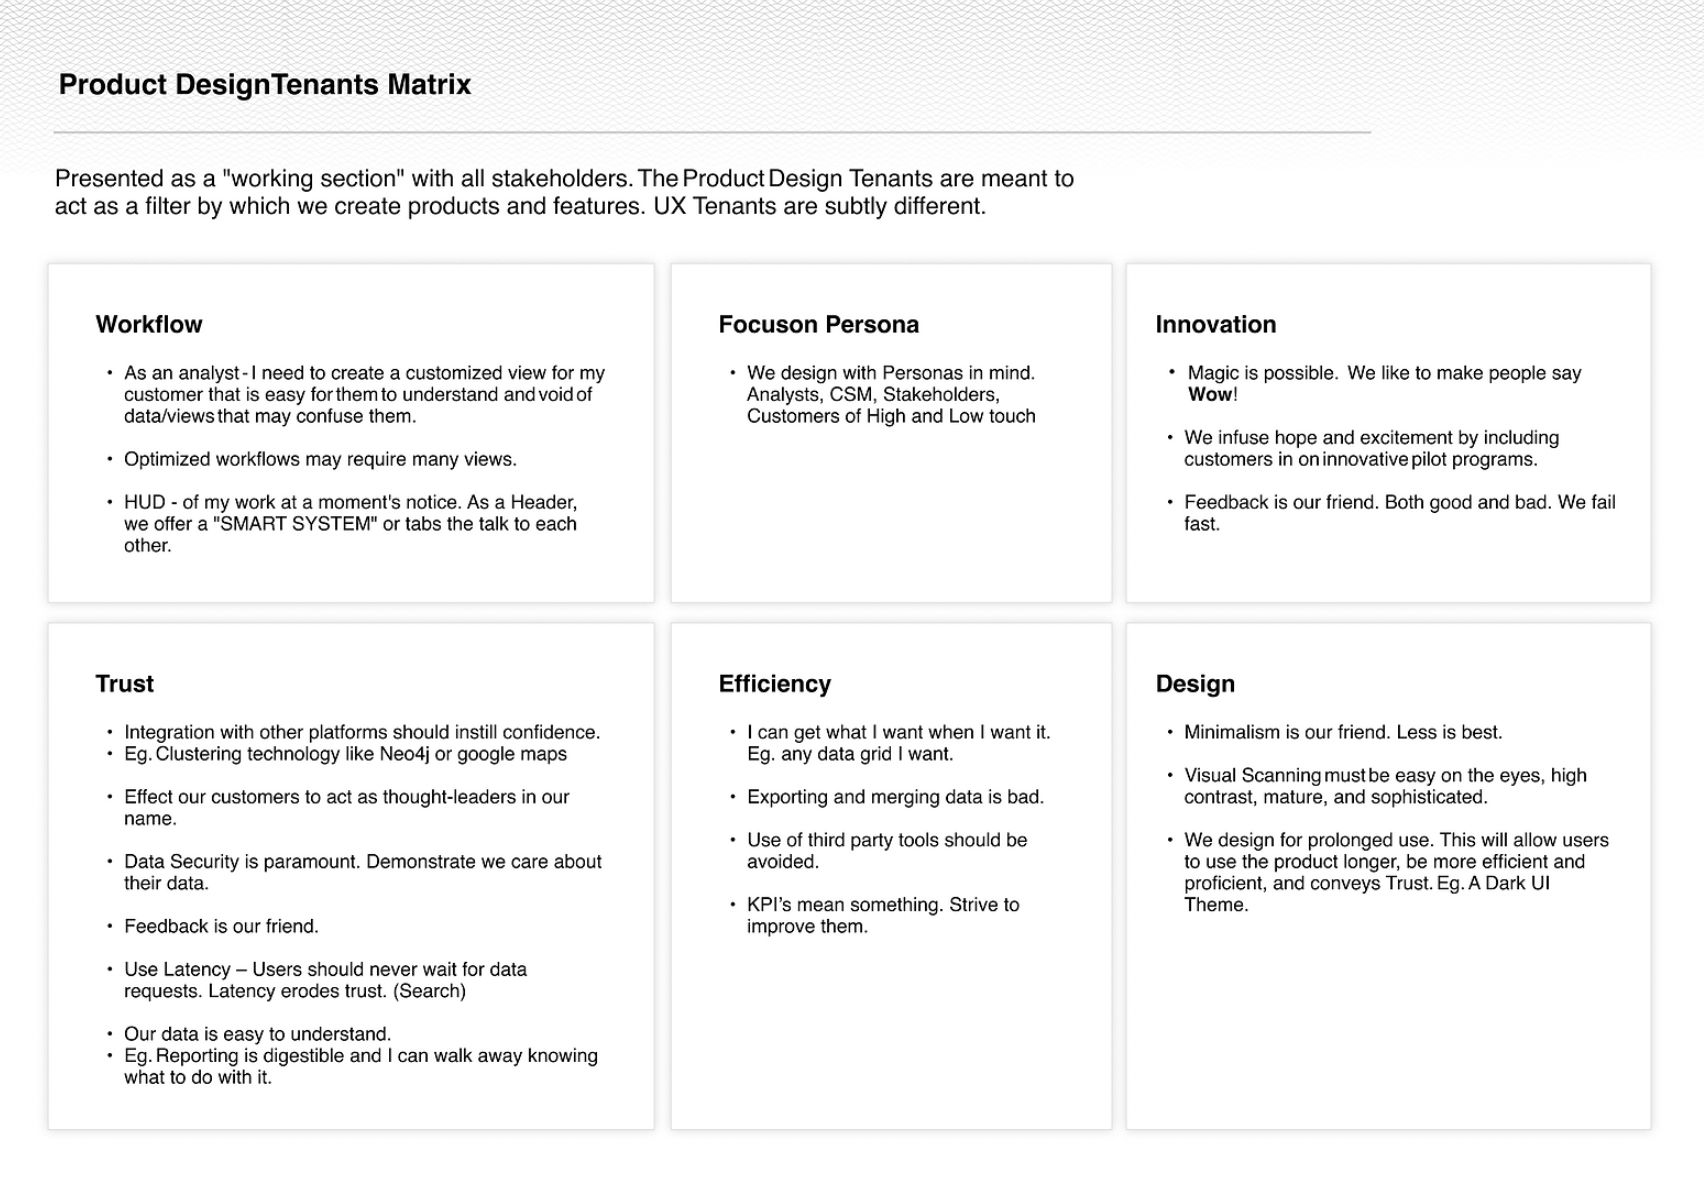

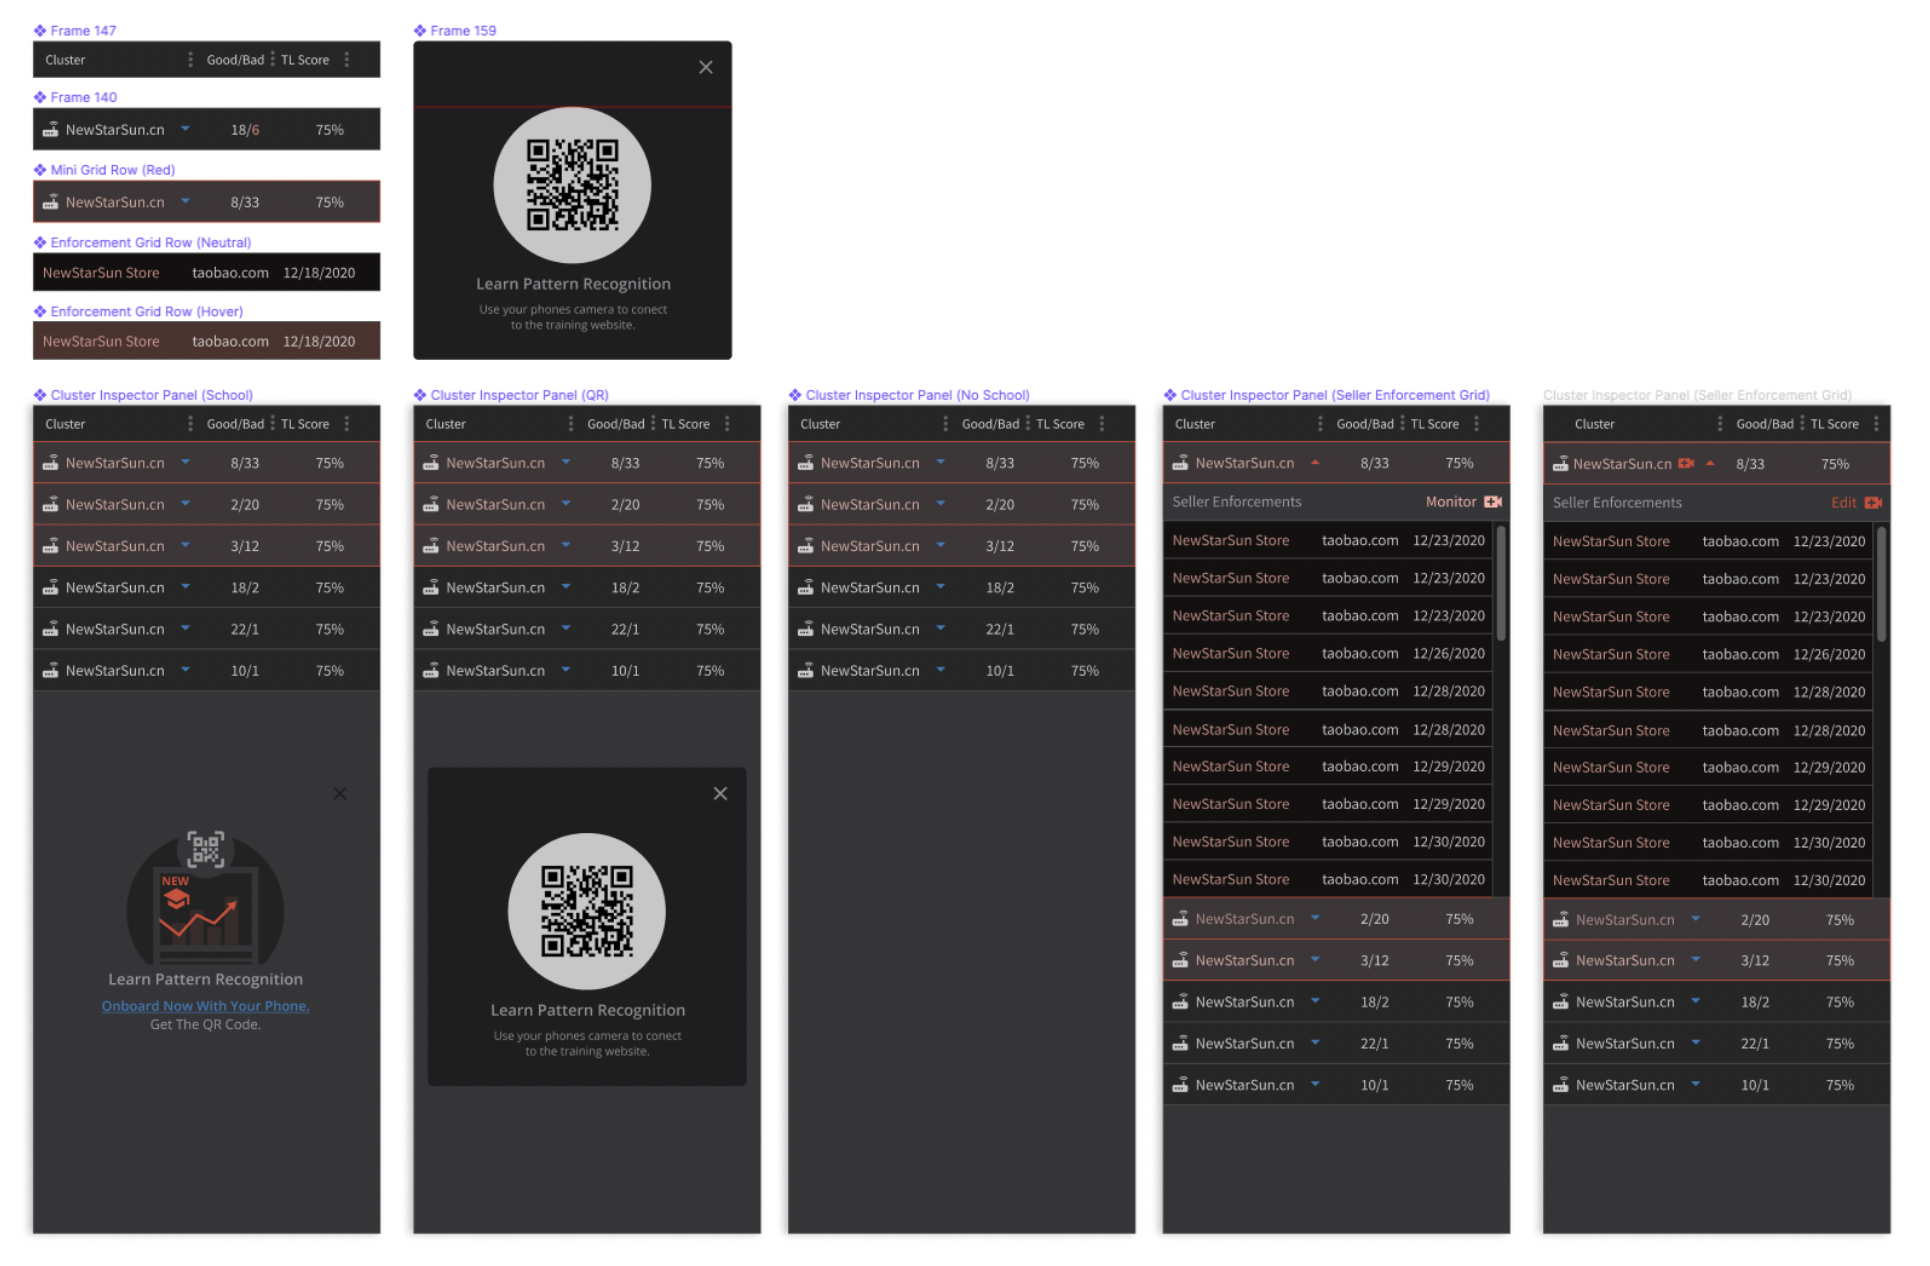












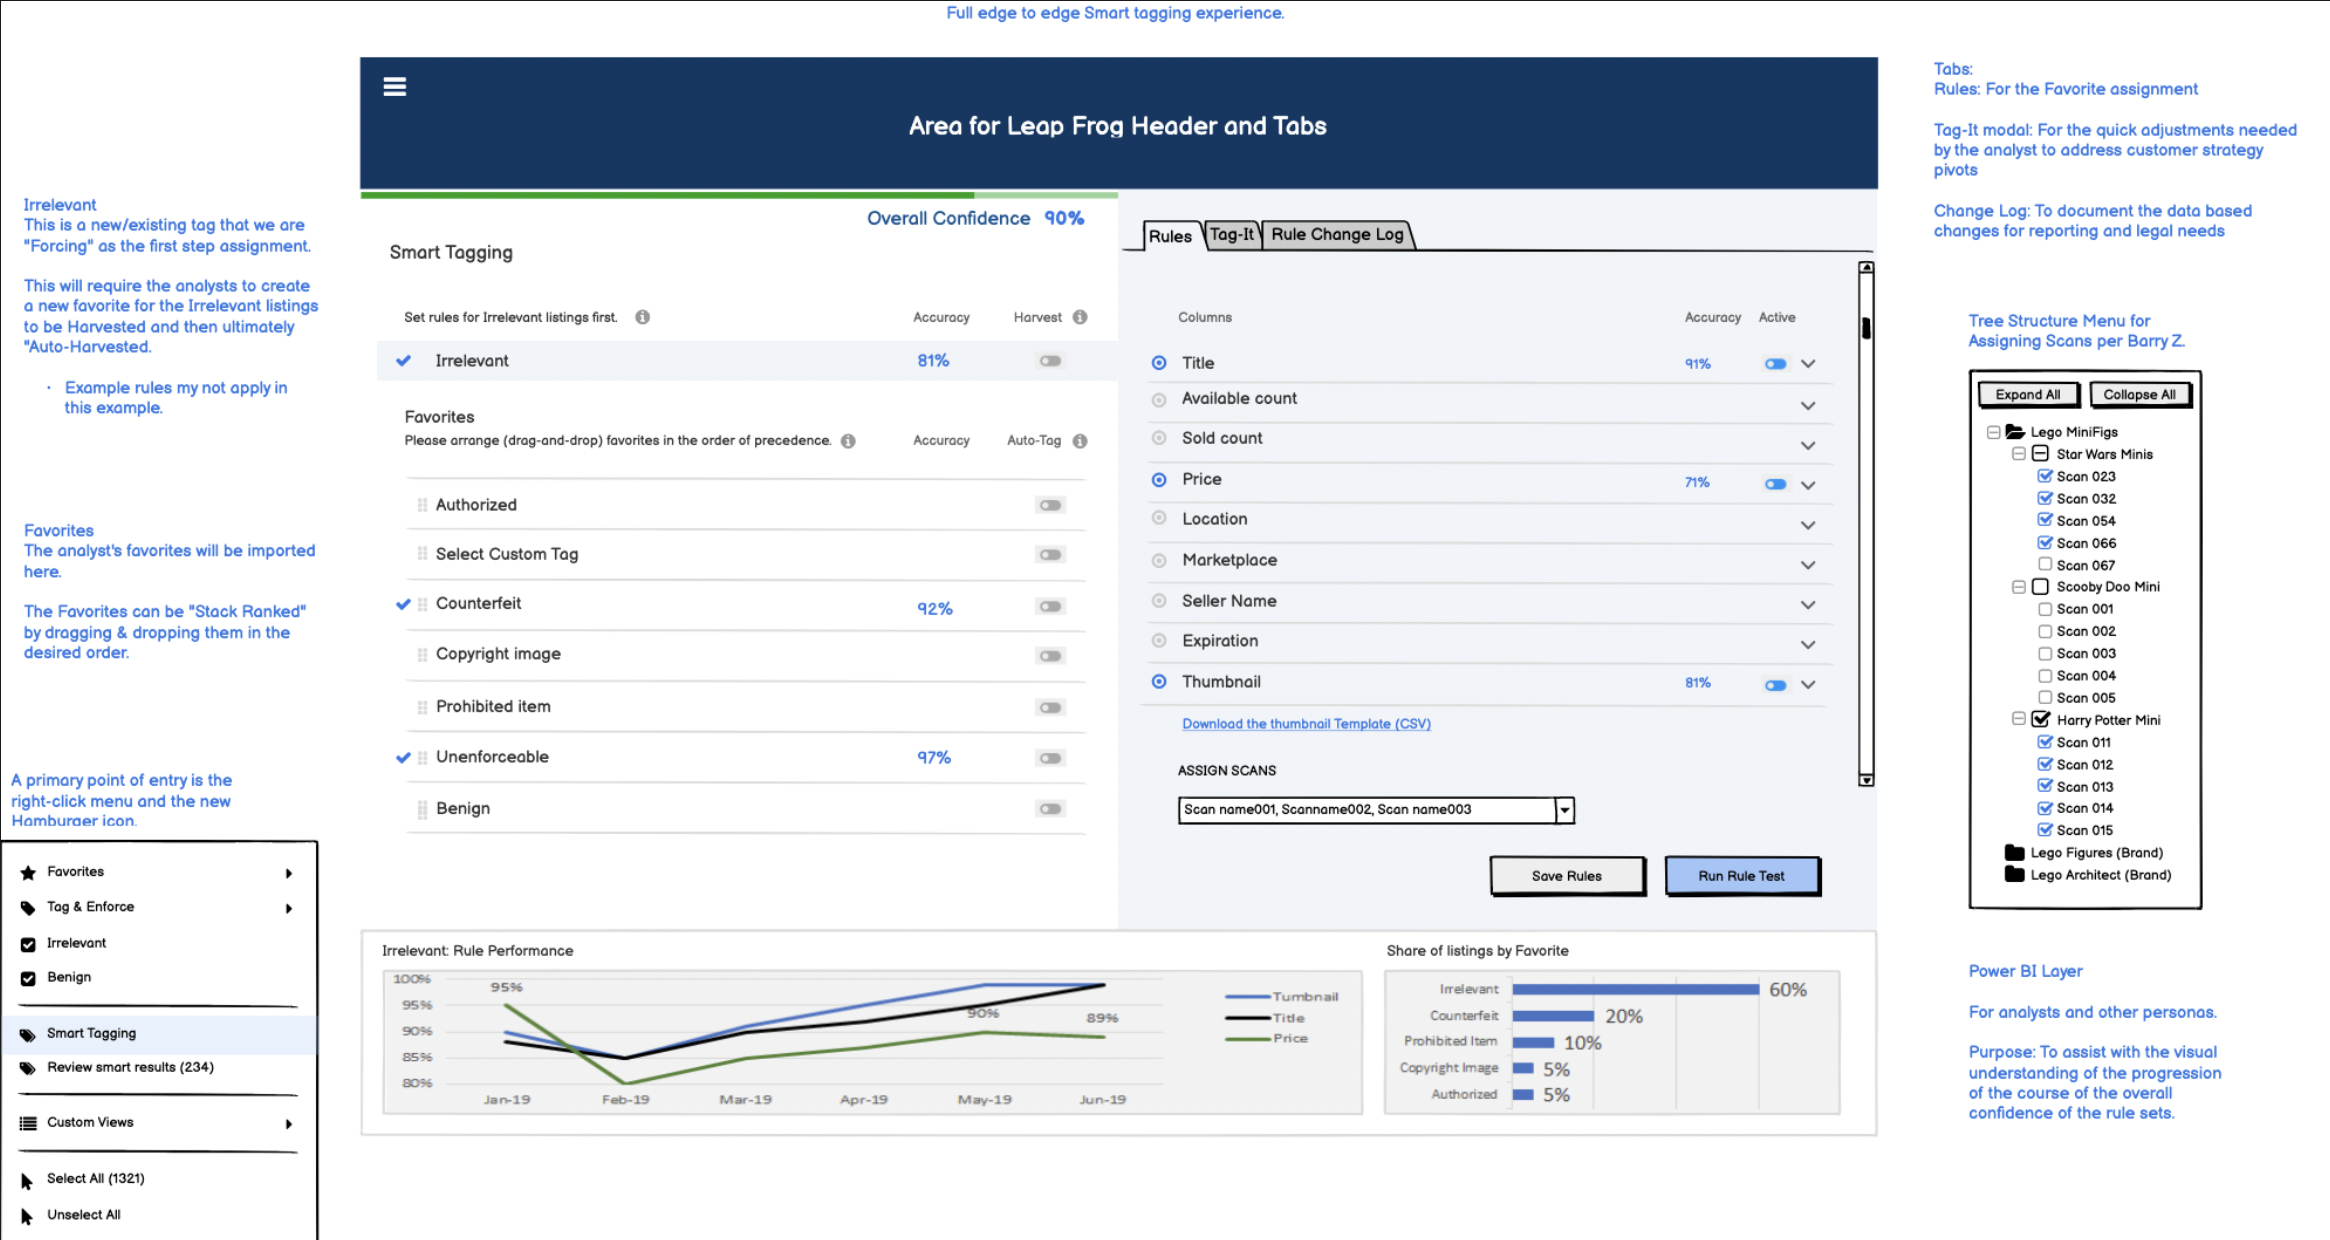

OpSec's marketplace module aggregates listings from marketplaces like eBay, Amazon, and Taobao so analysts can categorize products as benign or infringing and enforce clients' legal protections. Account losses traced back to trust and innovation gaps. This was a connected body of work across four fronts.
Research & the data-grid problem
The core friction was cognitive load across data grids: 180+ column types, heavy horizontal scrolling, and a heavily modified Kendo grid. Pair design, user testing, and ethnographic research (grounded in Build-Test-Measure) set the direction: reduce load, unify interfaces, and fix column management.
Network Intelligence: visualizing bad-actor patterns
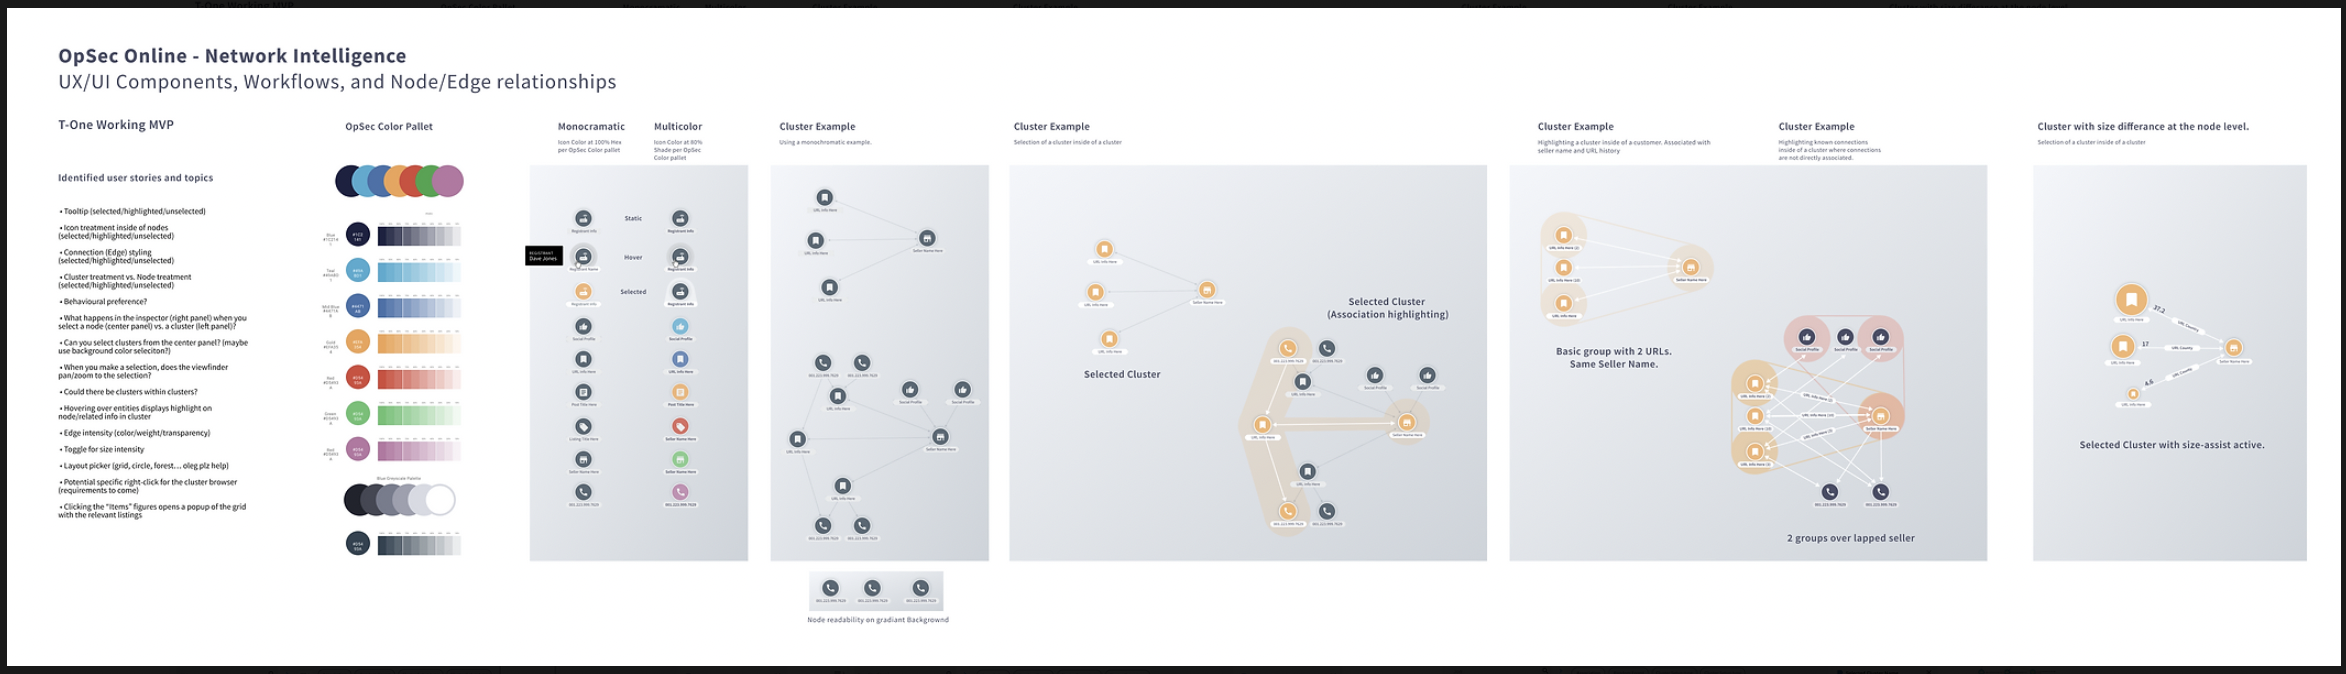
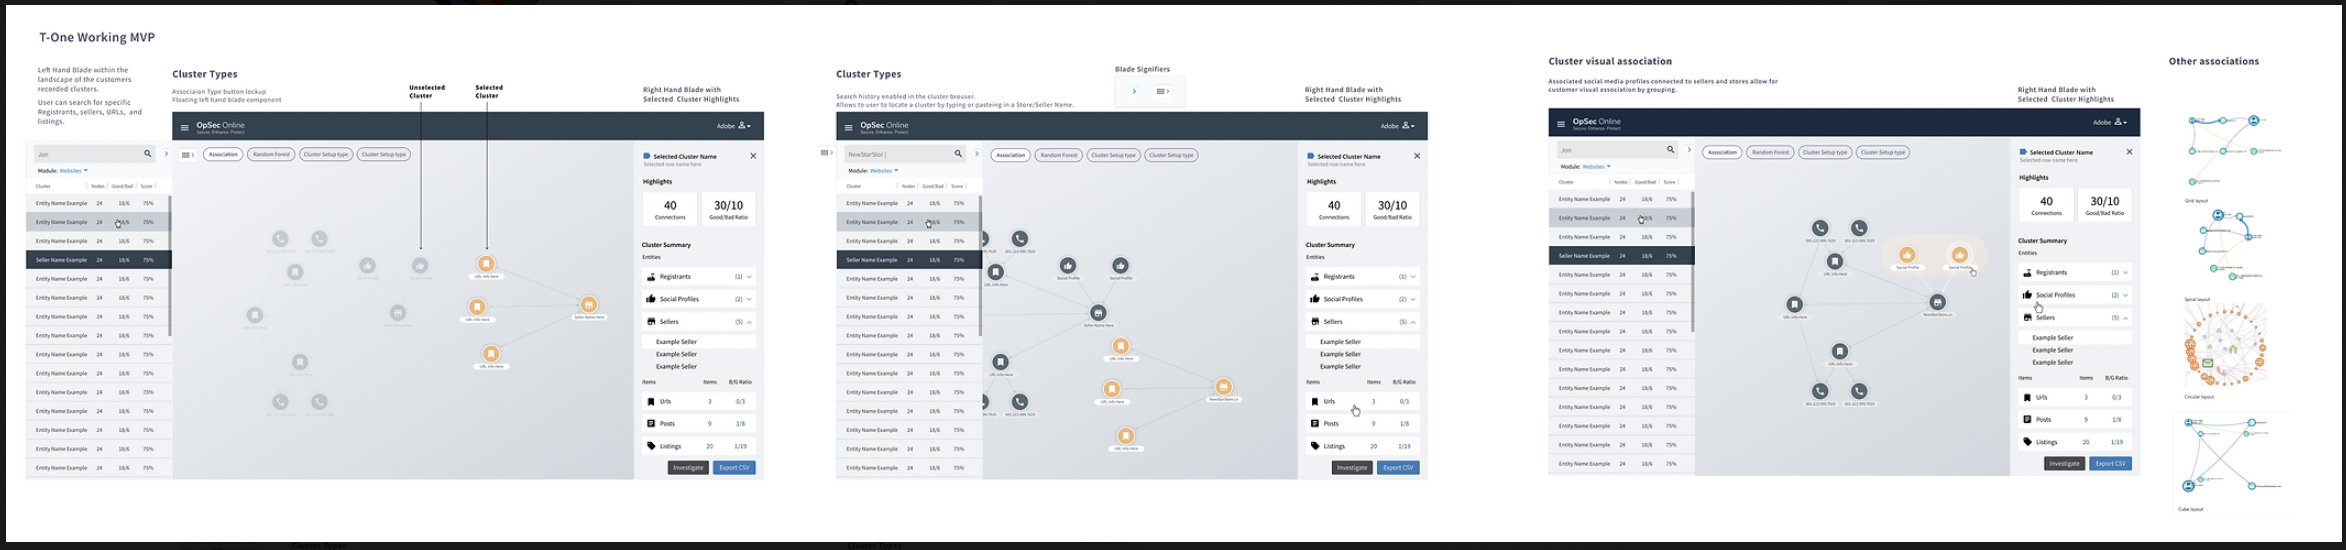
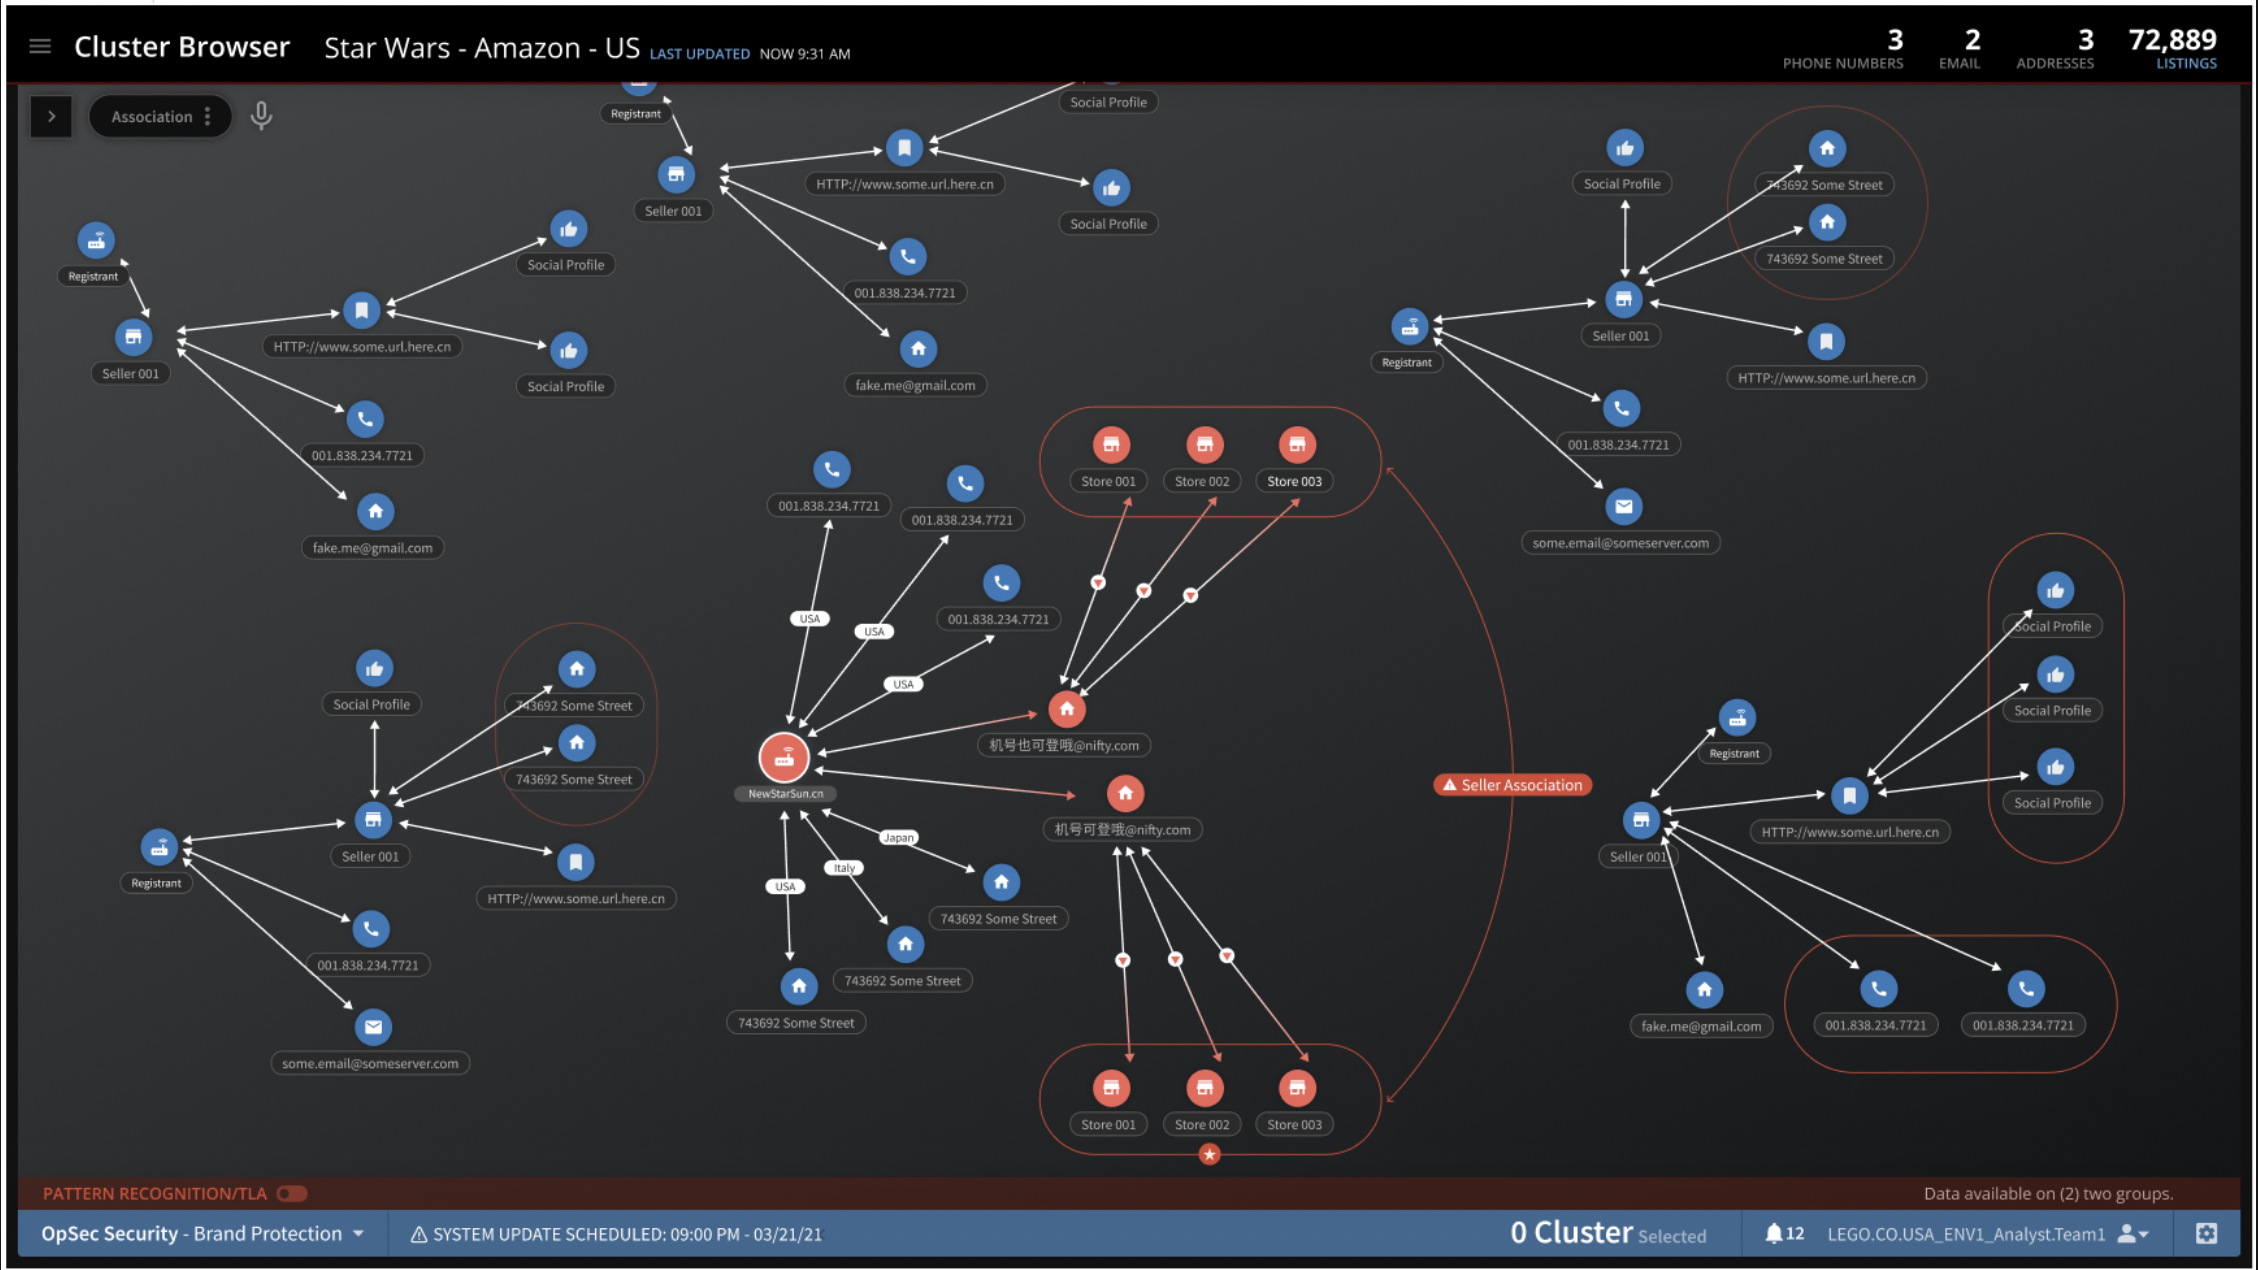
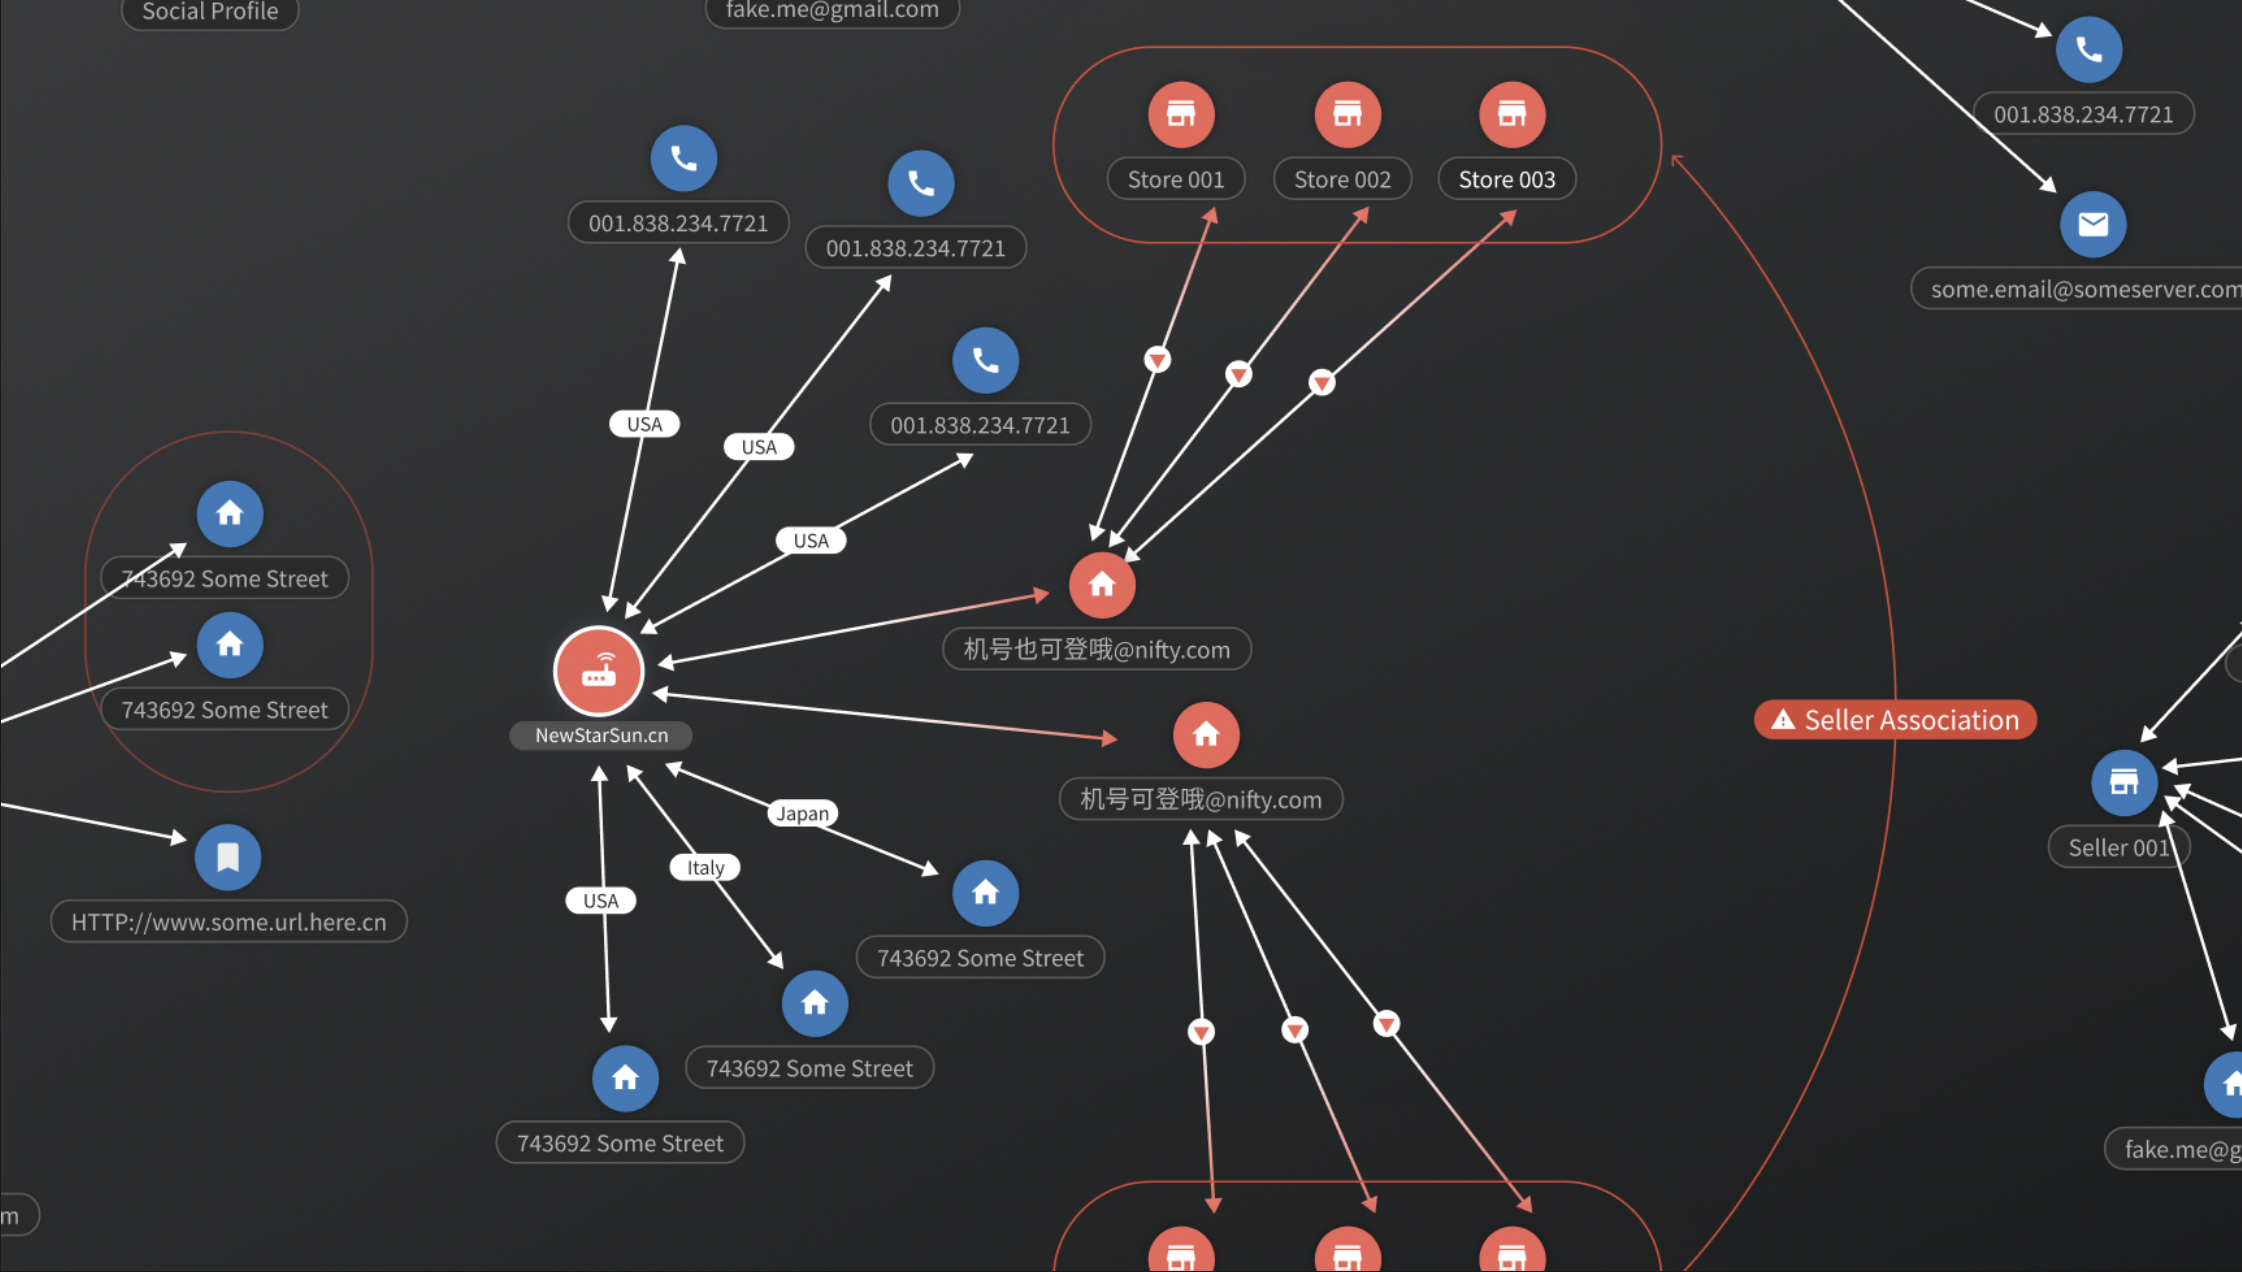
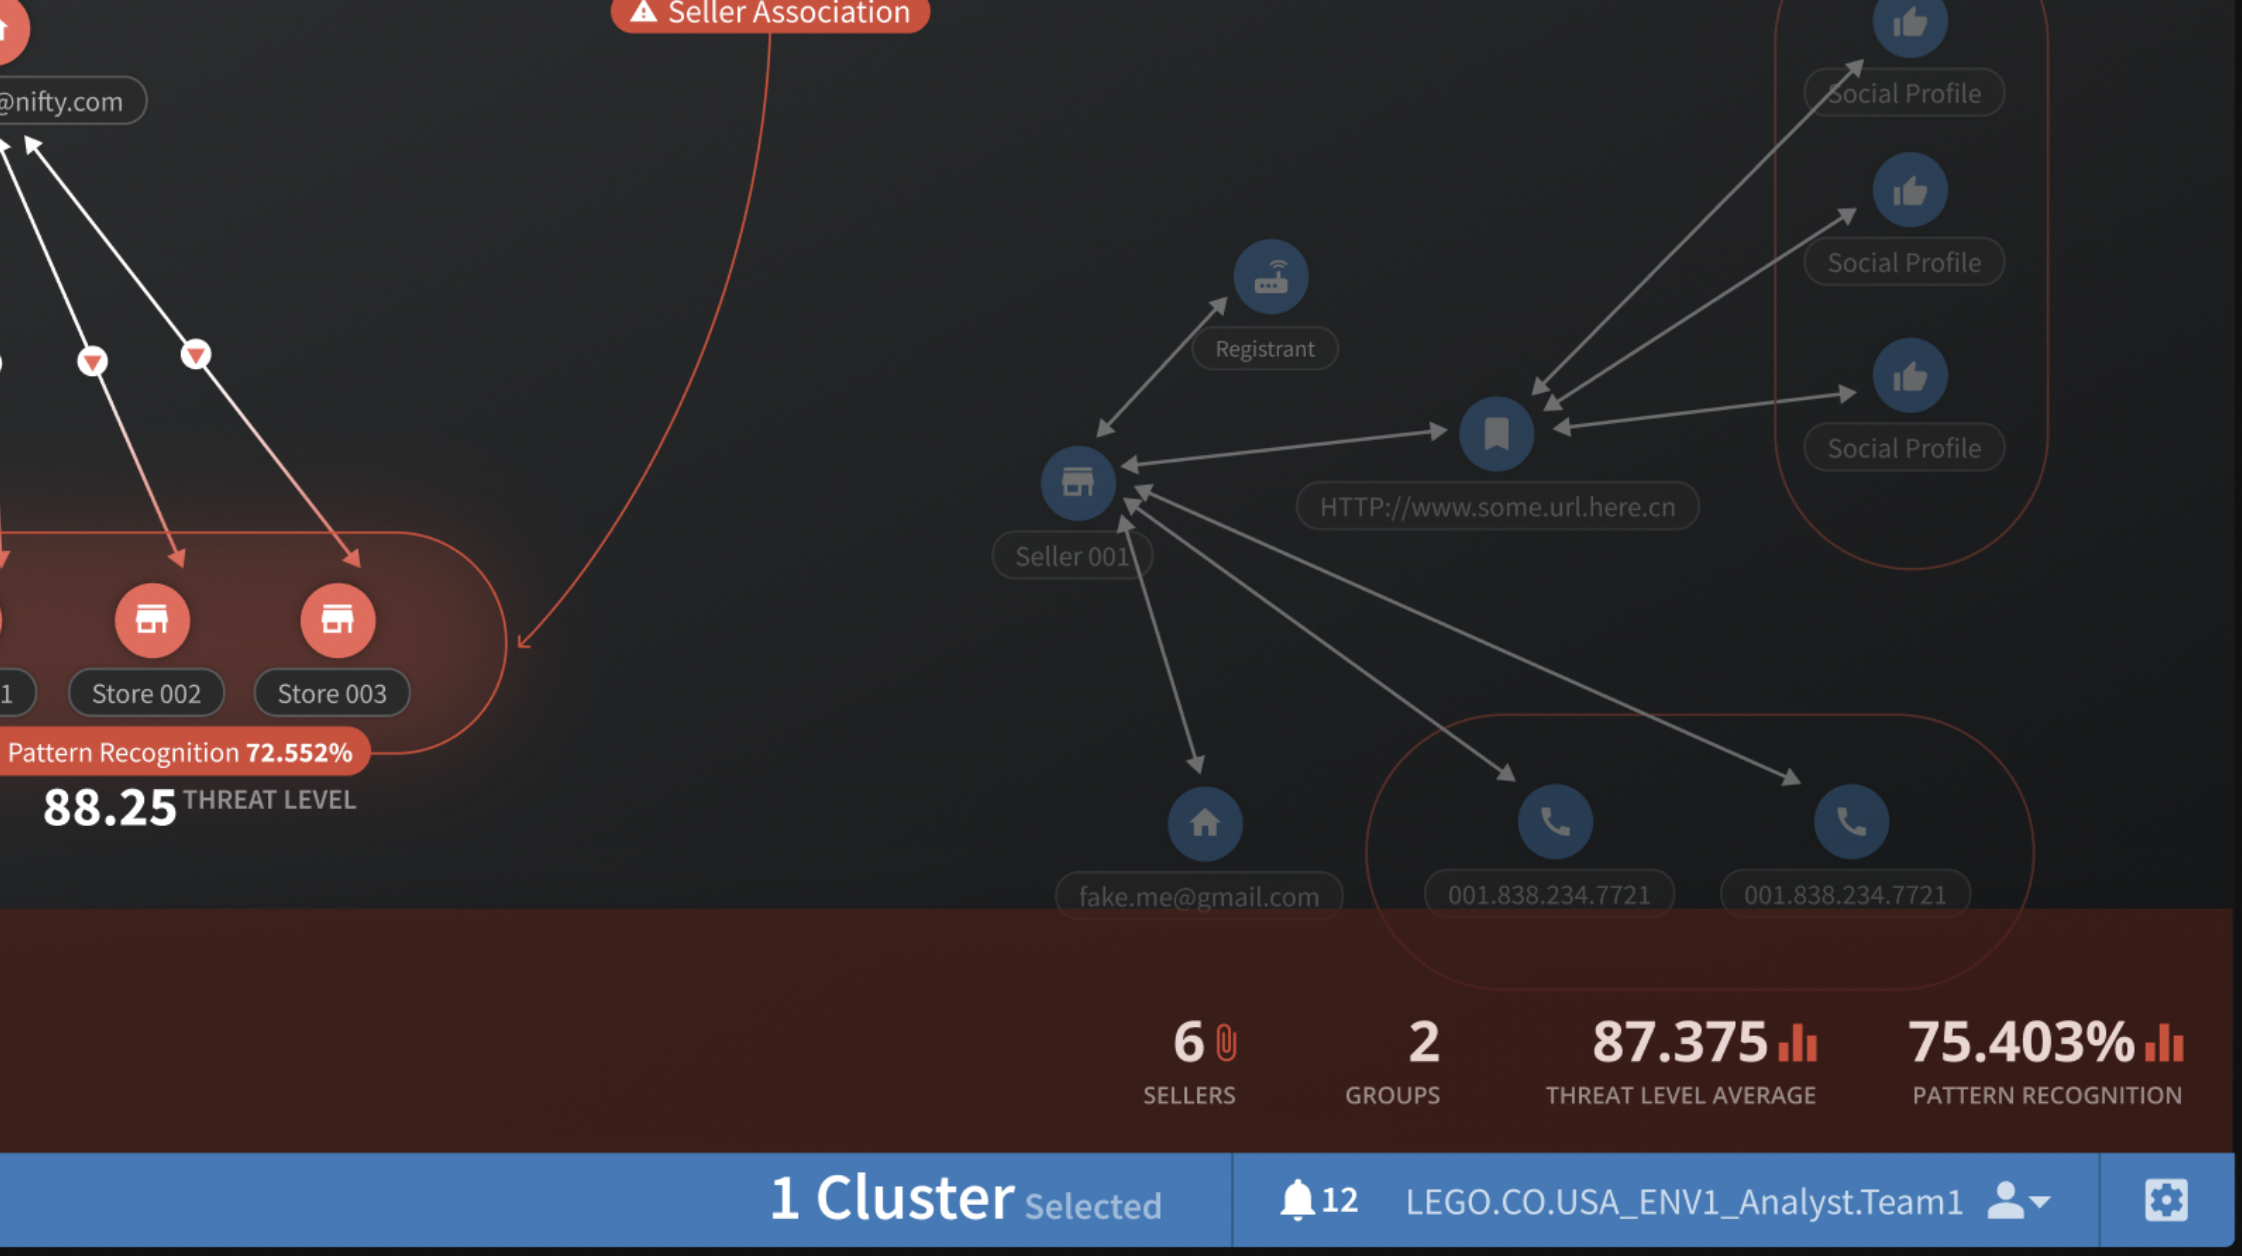
Discovery introduced graph databases (ArangoDB, Neo4j) to cluster historical enforcement data, linking bad actors across global marketplaces by shared signals like IP addresses and phone numbers. A tiered model followed: tier one visualizes existing clusters; tier two (paywalled) adds Threat Level Analysis and Pattern Recognition scoring, moving analysts from reacting to predicting. Hand-drawn, persona-driven sketches secured leadership buy-in for the MVP.
Smart Tabs: a customizable HUD
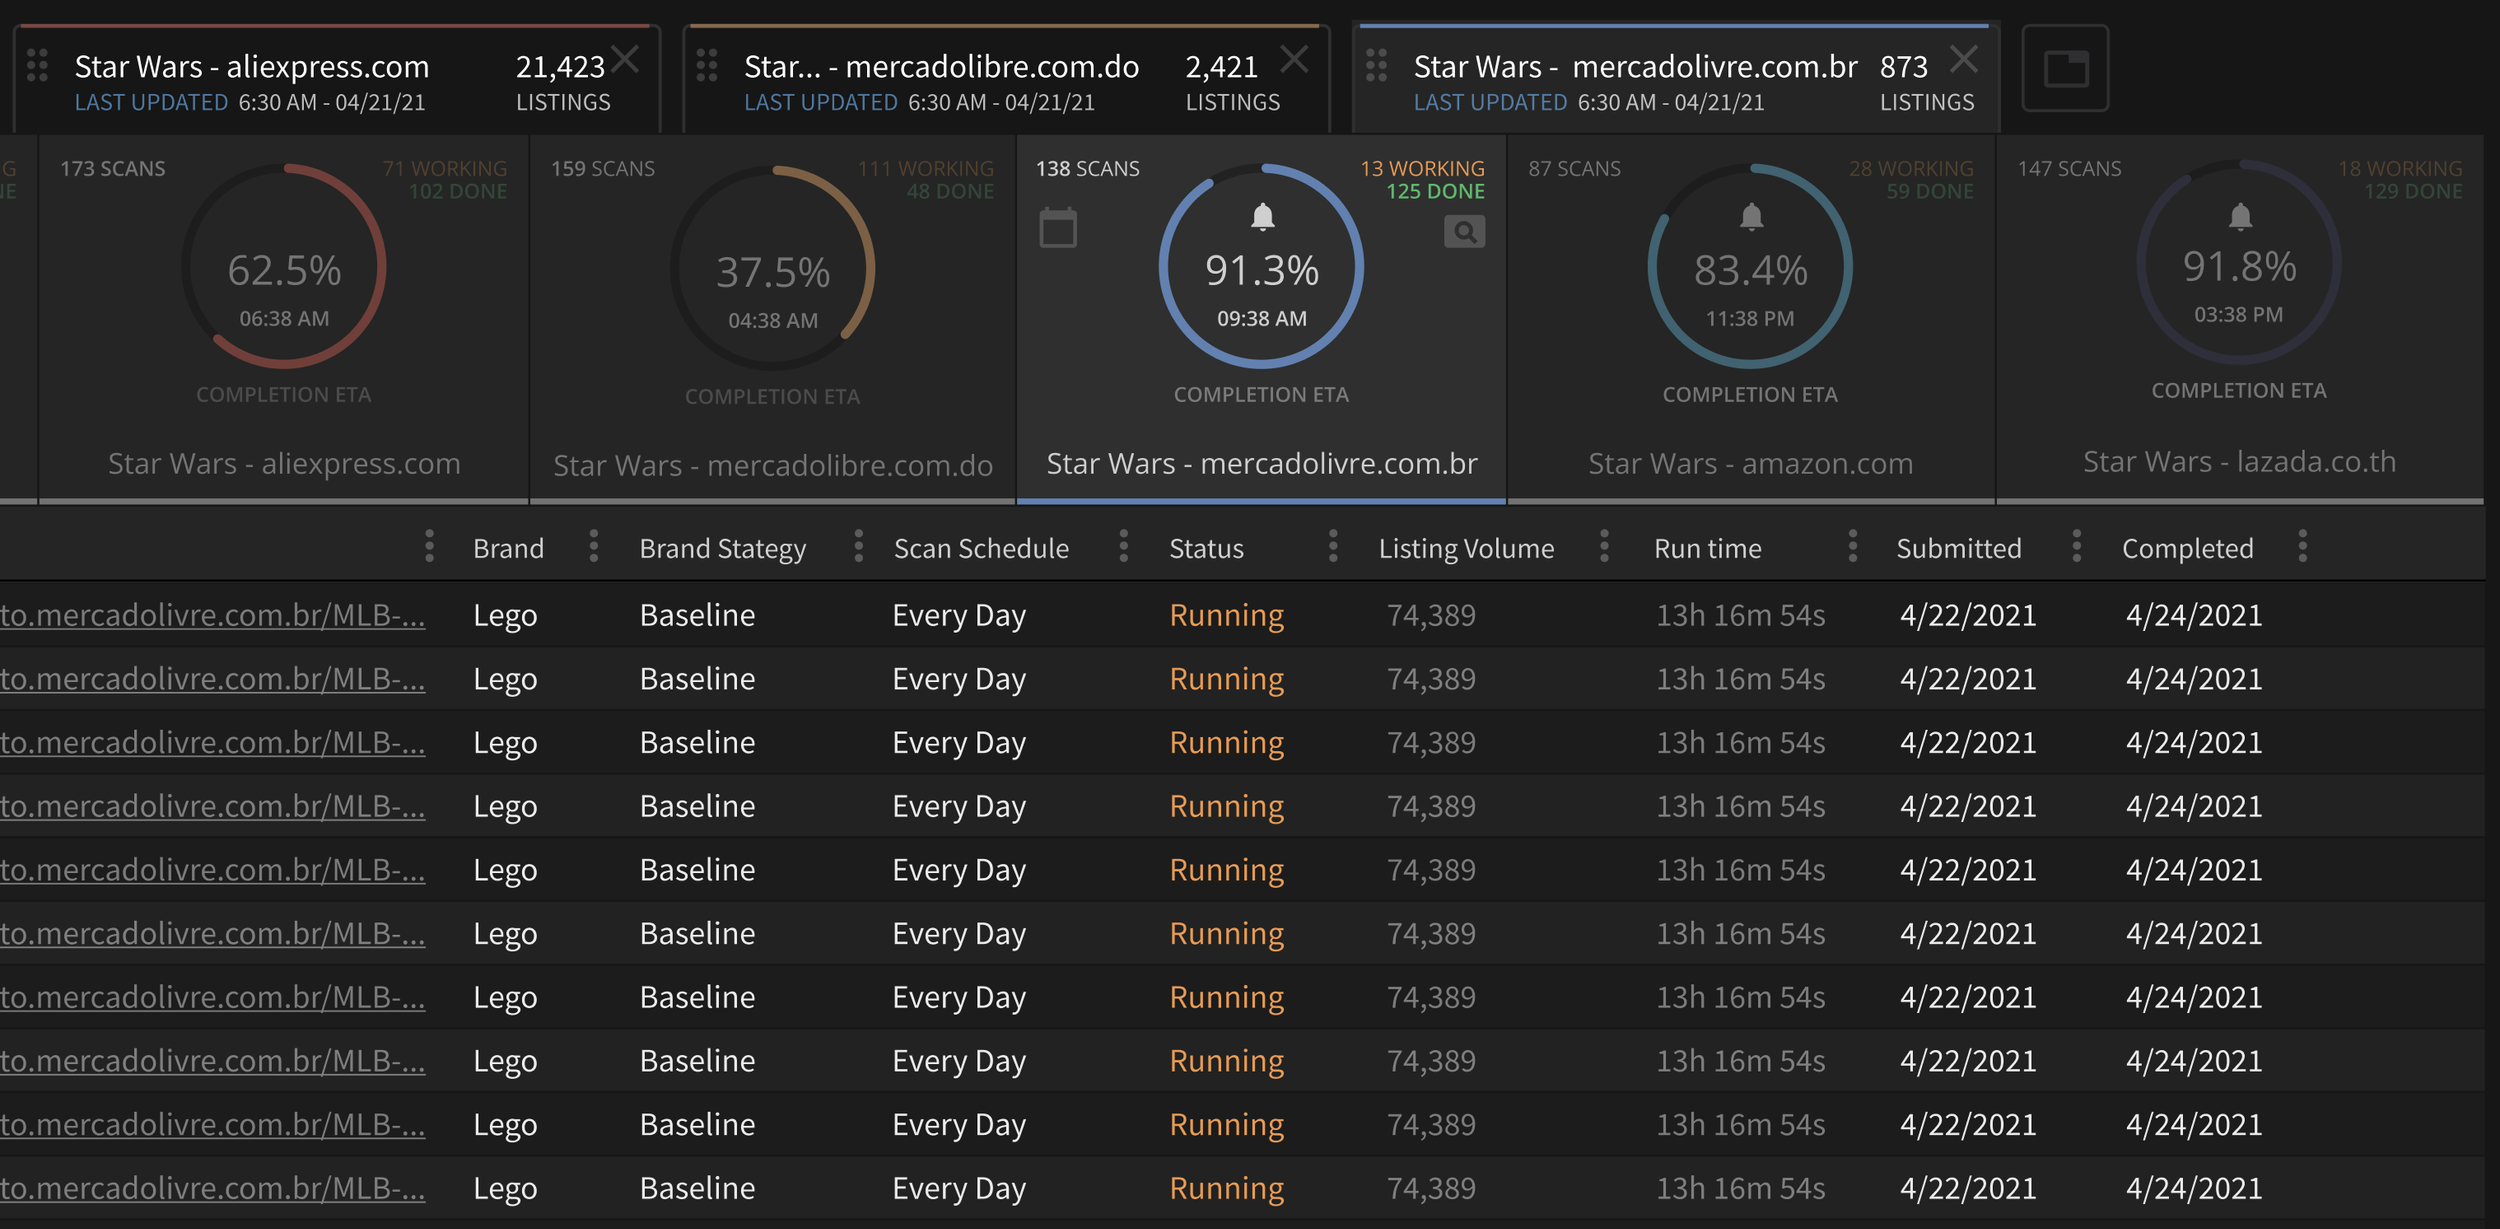
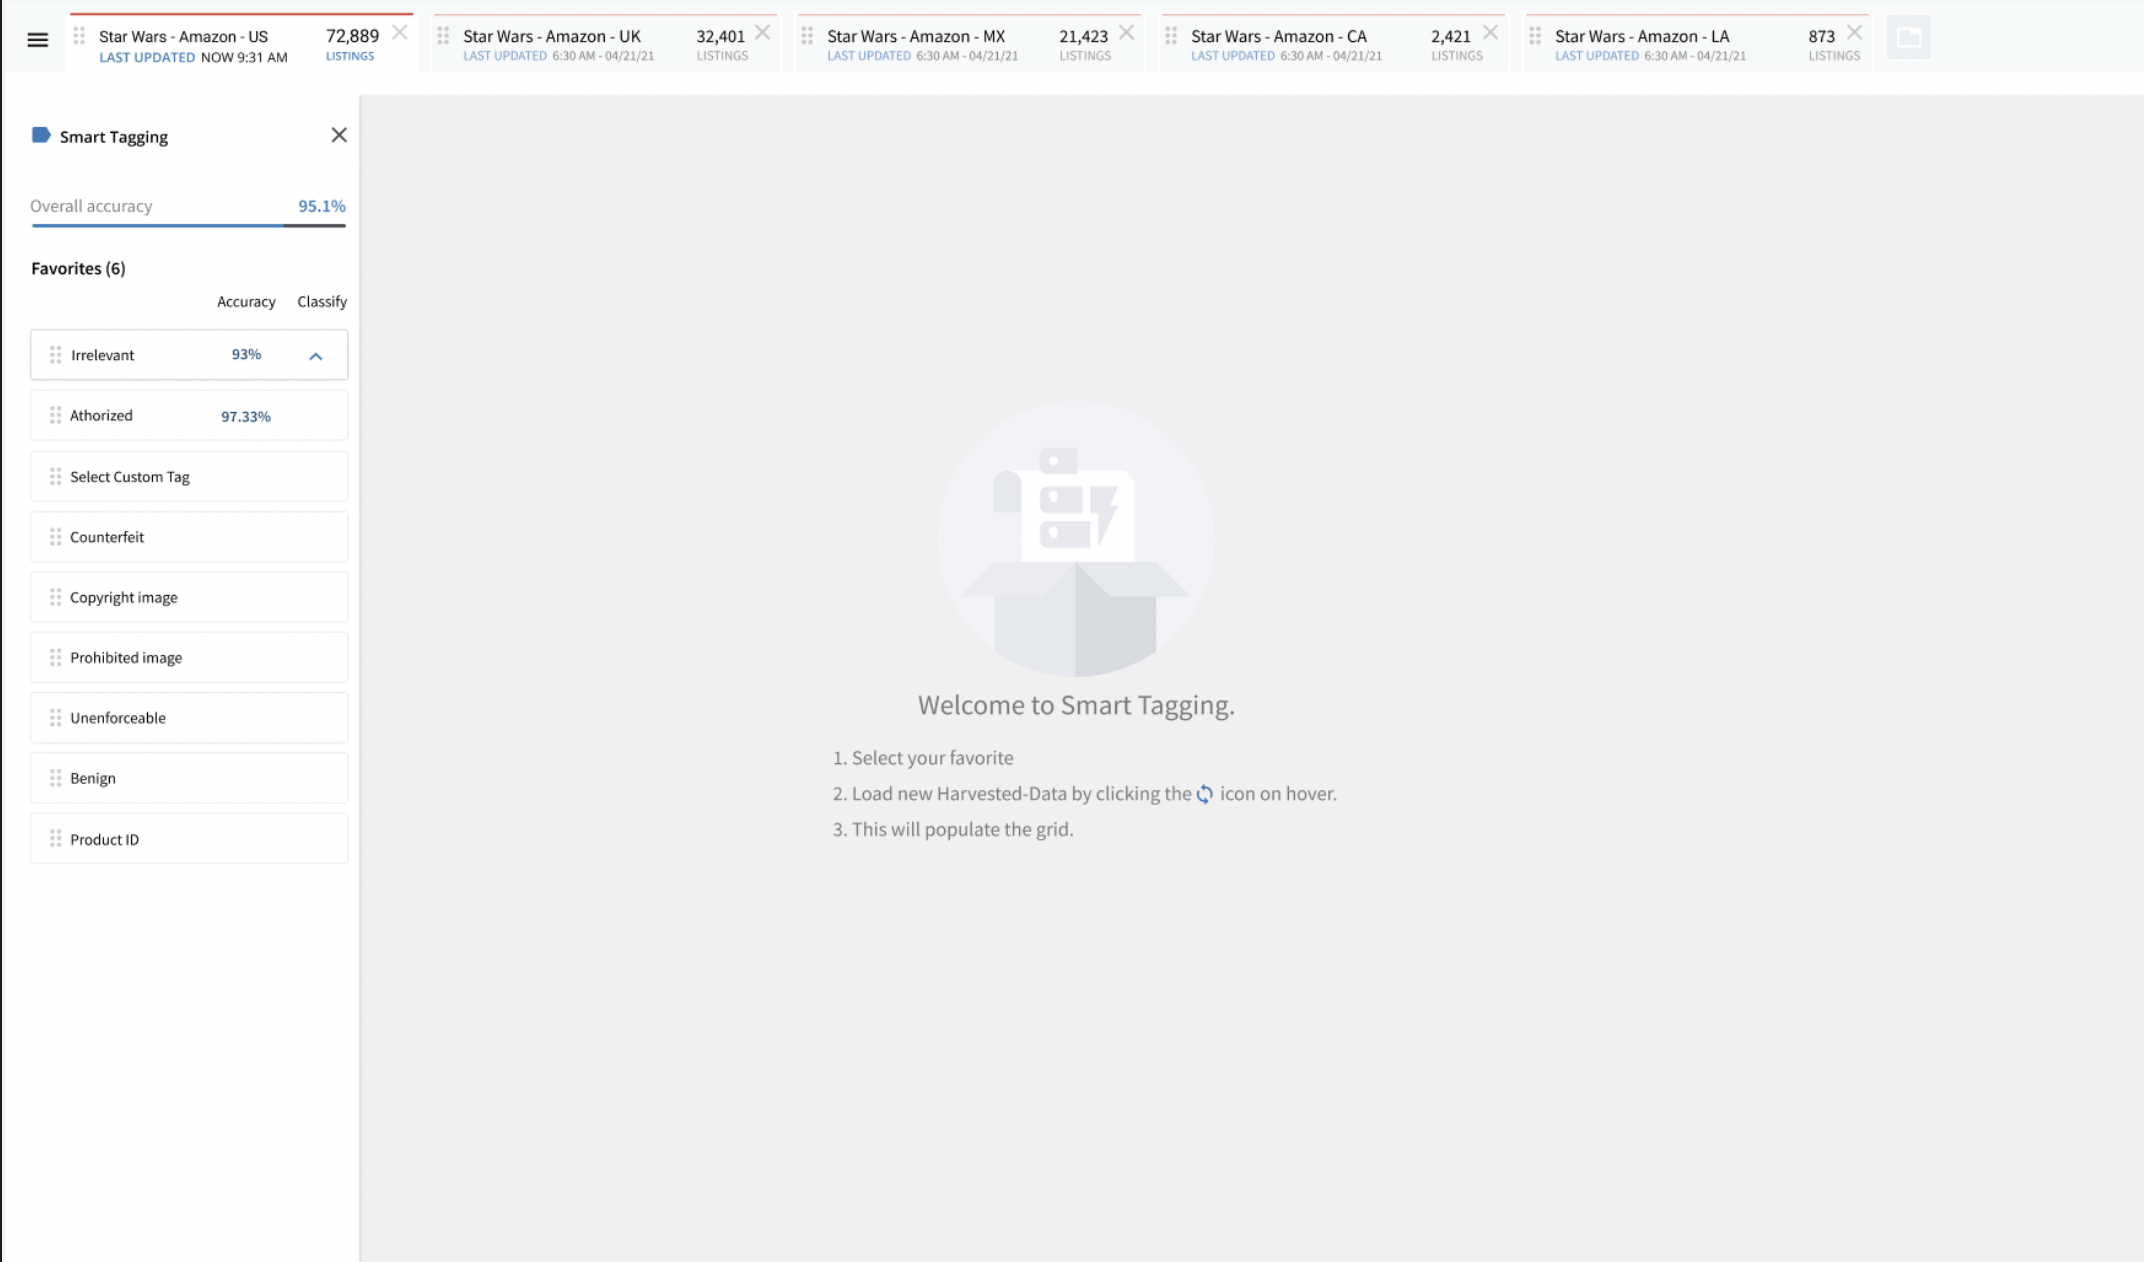
A heads-up display let analysts view several custom tabs at once, masking system latency while keeping visibility across marketplaces. A redesigned, high-contrast scan-scheduling grid broke the monotony of identical grids, and accessibility work (AA/AAA criteria, Figma accessibility plugin) made dense tables readable.
Smart Tagging: transparent ML automation
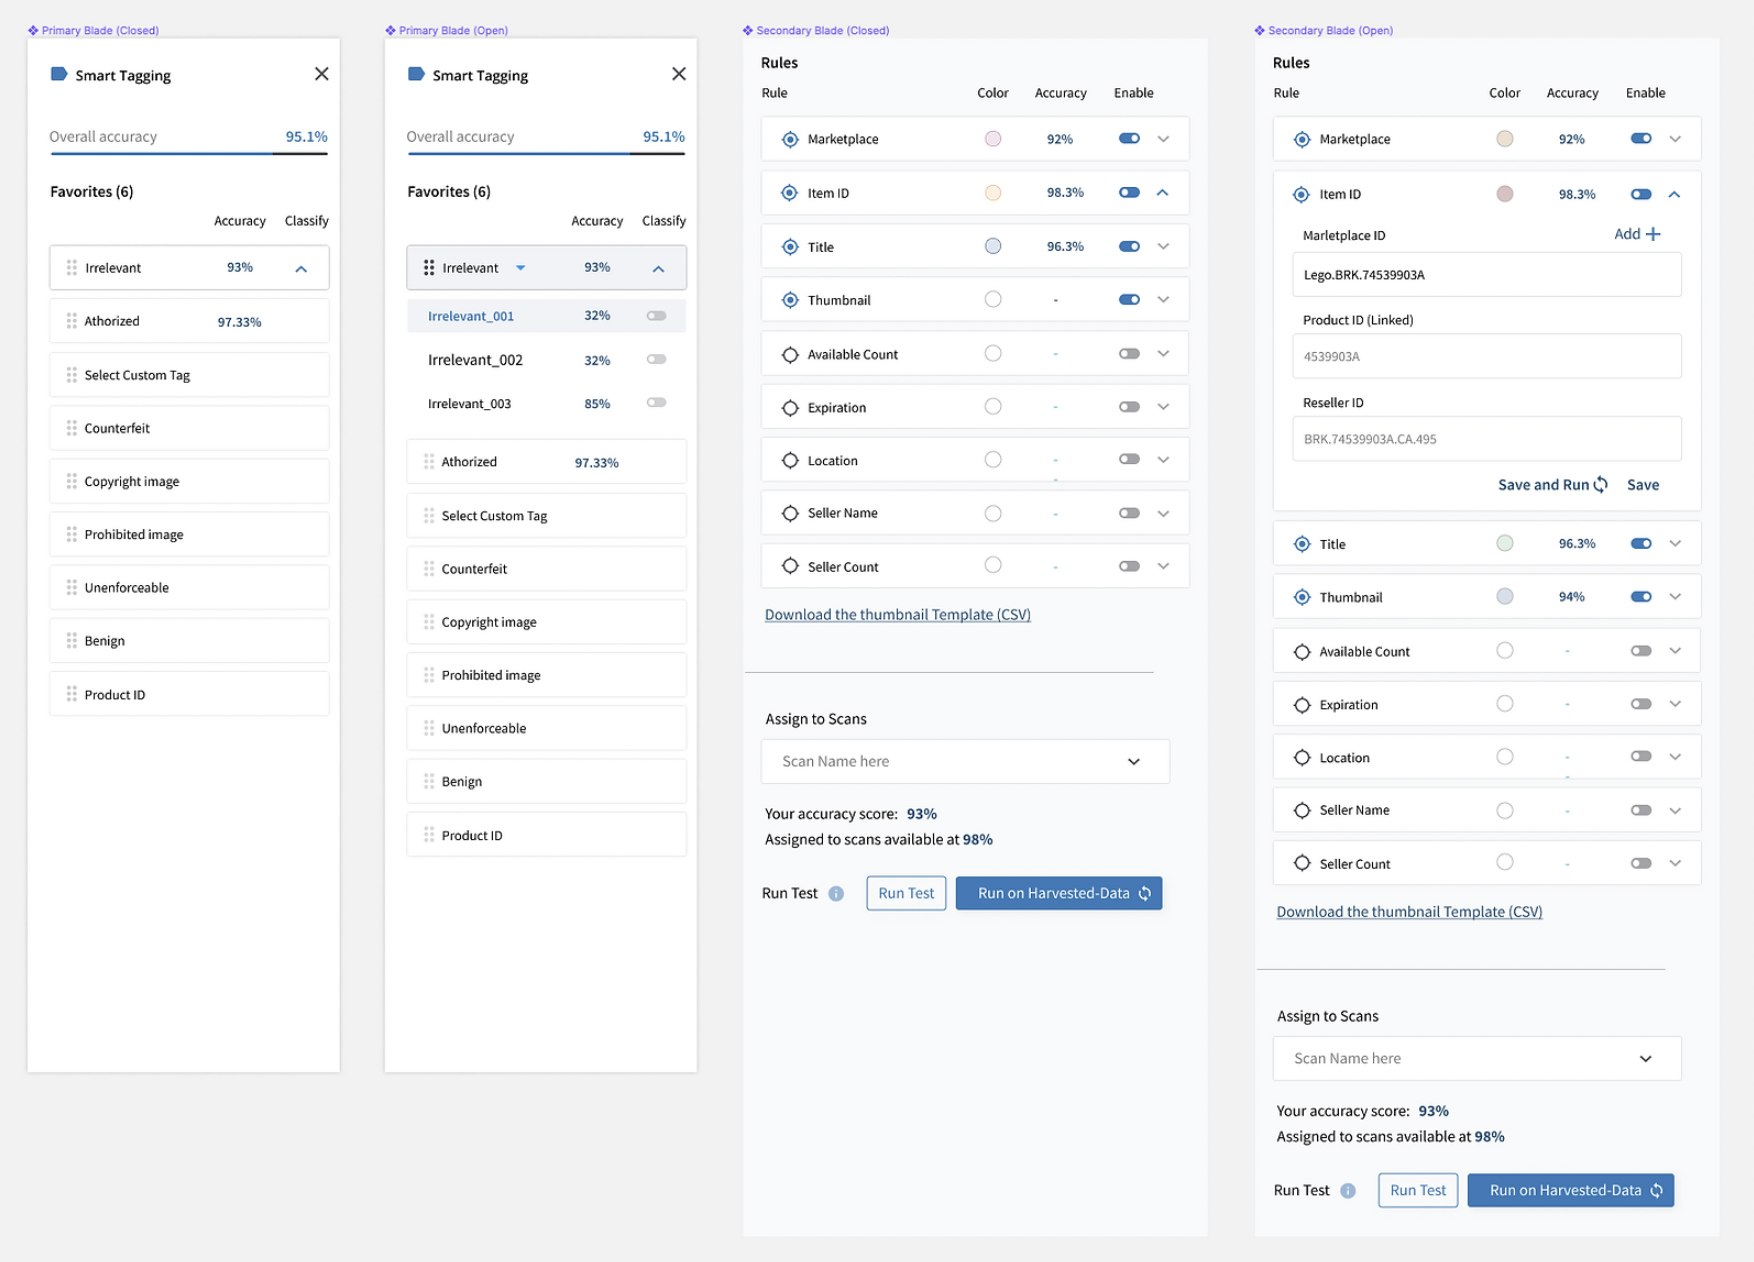
Rather than a black box, an open-box tagging system let analysts write their own ML classification rules with parent/child tags, refining the model until accuracy thresholds triggered automation. Transparency built the trust earlier automation attempts had lacked.
Initial KPIs: efficiency gains up to 62% in some cases, with a baseline of 18-24% in day-to-day review.
See the network graph evolve from marker sketch to Figma to a live, coded experience in the Live Cluster Browser in the Lab.
Skills: Product Strategy, UX Design, UX Research, Data Visualization, Design Systems, Product Ownership.